
Equation of state#
pop_tools.eos implements the model’s equation of state.
%matplotlib inline
import xarray as xr

import pop_tools
Show check value#
McDougall, T.J., D.R. Jackett, D.G. Wright, and R. Feistel, 2003: Accurate and Computationally Efficient Algorithms for Potential Temperature and Density of Seawater. J. Atmos. Oceanic Technol., 20, 730–741, doi:10.1175/1520-0426(2003)20<730:AACEAF>2.0.CO;2.
test value:
\(rho = 1033.213387 kg/m^3\);
\(S = 35.0\) PSU, \(theta = 20.0\) C, \(pressure = 2000.0\) dbars
pop_tools.eos(salt=35.0, temp=20.0, pressure=2000.0)
np.float64(1033.2133865866824)
Load POP dataset using dask#
filepath = pop_tools.DATASETS.fetch("cesm_pop_monthly.T62_g17.nc")
ds = xr.open_dataset(filepath, decode_times=False, decode_coords=False, chunks={'z_t': 20})
ds
Downloading file 'cesm_pop_monthly.T62_g17.nc' from 'https://ftp.cgd.ucar.edu/archive/aletheia-data/cesm-data/ocn/cesm_pop_monthly.T62_g17.nc' to '/home/docs/.pop_tools/data'.
/home/docs/checkouts/readthedocs.org/user_builds/pop-tools/conda/latest/lib/python3.9/site-packages/xarray/core/dataset.py:277: UserWarning: The specified chunks separate the stored chunks along dimension "z_t" starting at index 20. This could degrade performance. Instead, consider rechunking after loading.
  warnings.warn(
<xarray.Dataset> Size: 122MB
Dimensions:       (time: 1, z_t: 60, nlat: 384, nlon: 320, lat_aux_grid: 395,
                   d2: 2)
Coordinates:
  * lat_aux_grid  (lat_aux_grid) float32 2kB -79.49 -78.95 -78.42 ... 89.47 90.0
  * time          (time) float64 8B 6.314e+04
  * z_t           (z_t) float32 240B 500.0 1.5e+03 ... 5.125e+05 5.375e+05
Dimensions without coordinates: nlat, nlon, d2
Data variables:
    SALT          (time, z_t, nlat, nlon) float32 29MB dask.array<chunksize=(1, 20, 384, 320), meta=np.ndarray>
    TEMP          (time, z_t, nlat, nlon) float32 29MB dask.array<chunksize=(1, 20, 384, 320), meta=np.ndarray>
    TLAT          (nlat, nlon) float64 983kB dask.array<chunksize=(384, 320), meta=np.ndarray>
    TLONG         (nlat, nlon) float64 983kB dask.array<chunksize=(384, 320), meta=np.ndarray>
    ULAT          (nlat, nlon) float64 983kB dask.array<chunksize=(384, 320), meta=np.ndarray>
    ULONG         (nlat, nlon) float64 983kB dask.array<chunksize=(384, 320), meta=np.ndarray>
    UVEL          (time, z_t, nlat, nlon) float32 29MB dask.array<chunksize=(1, 20, 384, 320), meta=np.ndarray>
    VVEL          (time, z_t, nlat, nlon) float32 29MB dask.array<chunksize=(1, 20, 384, 320), meta=np.ndarray>
    time_bound    (time, d2) float64 16B dask.array<chunksize=(1, 2), meta=np.ndarray>
Attributes:
    title:             g.e21.G1850ECOIAF.T62_g17.004
    history:           Sun May 26 14:13:02 2019: ncks -4 -L 9 cesm_pop_monthl...
    Conventions:       CF-1.0; http://www.cgd.ucar.edu/cms/eaton/netcdf/CF-cu...
    time_period_freq:  month_1
    model_doi_url:     https://doi.org/10.5065/D67H1H0V
    contents:          Diagnostic and Prognostic Variables
    source:            CCSM POP2, the CCSM Ocean Component
    revision:          $Id: tavg.F90 90507 2019-01-18 20:54:19Z altuntas@ucar...
    calendar:          All years have exactly  365 days.
    start_time:        This dataset was created on 2019-05-26 at 11:20:07.5
    cell_methods:      cell_methods = time: mean ==> the variable values are ...
NCO: netCDF Operators version 4.7.4 (http://nco.sf.net)Compute in situ density#
%%time
rho = pop_tools.eos(ds.SALT, ds.TEMP, depth=ds.z_t * 1e-2)
CPU times: user 4.75 ms, sys: 1.16 ms, total: 5.91 ms
Wall time: 6.63 ms
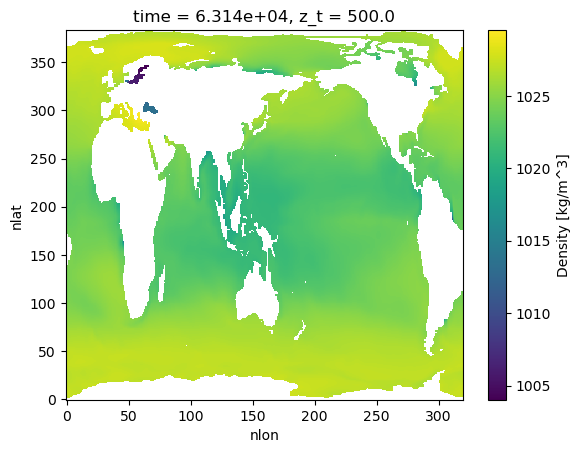
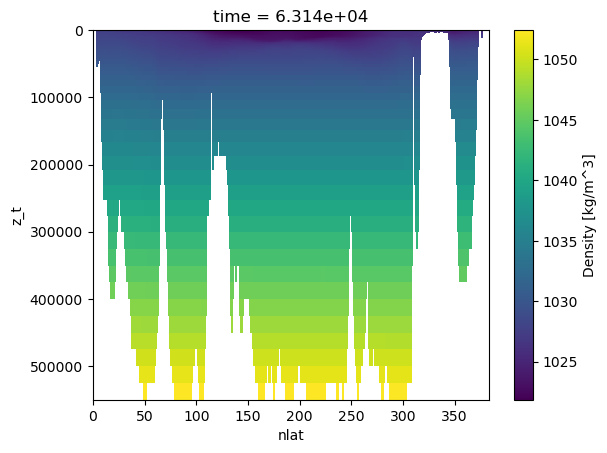
Visualize density field#
h = rho.isel(time=0, z_t=0).plot()
/home/docs/checkouts/readthedocs.org/user_builds/pop-tools/conda/latest/lib/python3.9/site-packages/numba/np/ufunc/dufunc.py:287: RuntimeWarning: invalid value encountered in _compute_eos
  return super().__call__(*args, **kws)
h = rho.isel(time=0, nlon=200).plot(yincrease=False)
%load_ext watermark
%watermark -d -iv -m -g -h
Compiler    : GCC 13.3.0
OS          : Linux
Release     : 6.17.0-1007-aws
Machine     : x86_64
Processor   : x86_64
CPU cores   : 2
Architecture: 64bit

Hostname: build-32095474-project-451810-pop-tools

Git hash: d3177f392237bc6adcac68c1963bdc5fe1a3ccd6

xarray   : 2024.7.0
pop_tools: 0.0.post50+dirty