Using xgcm.transform to interpolate to isopycnal space#
%load_ext watermark

import numpy as np
import xarray as xr
import xgcm

import pop_tools

%watermark -iv
pop_tools: 0.0.post50+dirty
xarray   : 2024.7.0
xgcm     : 0.8.1
numpy    : 2.0.2
Load data#
Read an existing sample dataset for the tropical pacific. Unfortunately, this particular subset does not have SALT, so for demonstration purposes we set SALT=35.
# open sample data
filepath = pop_tools.DATASETS.fetch('Pac_POP0.1_JRA_IAF_1993-12-6-test.nc')
ds = xr.open_dataset(filepath)

# get DZU and DZT, needed for operations later on
filepath_g = pop_tools.DATASETS.fetch("Pac_grid_pbc_1301x305x62.tx01_62l.2013-07-13.nc")
ds_g = xr.open_dataset(filepath_g)
ds.update(ds_g[["DZU", "DZT"]])

# There is no salinity, so let's  create a fake SALT variable
ds["SALT"] = 35 * xr.ones_like(ds.TEMP)
ds.SALT.attrs["grid_loc"] = ds.TEMP.attrs["grid_loc"]
ds
Downloading file 'Pac_POP0.1_JRA_IAF_1993-12-6-test.nc' from 'https://ftp.cgd.ucar.edu/archive/aletheia-data/cesm-data/ocn/Pac_POP0.1_JRA_IAF_1993-12-6-test.nc' to '/home/docs/.pop_tools/data'.
Downloading file 'Pac_grid_pbc_1301x305x62.tx01_62l.2013-07-13.nc' from 'https://ftp.cgd.ucar.edu/archive/aletheia-data/cesm-data/ocn/Pac_grid_pbc_1301x305x62.tx01_62l.2013-07-13.nc' to '/home/docs/.pop_tools/data'.
<xarray.Dataset> Size: 2GB
Dimensions:         (time: 1, z_t: 62, nlat: 305, nlon: 1301, z_w_top: 62,
                     z_w: 62, z_w_bot: 62)
Coordinates:
  * time            (time) object 8B 0036-12-07 00:00:00
  * z_t             (z_t) float32 248B 500.0 1.5e+03 ... 5.625e+05 5.875e+05
  * z_w             (z_w) float32 248B 0.0 1e+03 2e+03 ... 5.5e+05 5.75e+05
  * z_w_top         (z_w_top) float32 248B 0.0 1e+03 2e+03 ... 5.5e+05 5.75e+05
  * z_w_bot         (z_w_bot) float32 248B 1e+03 2e+03 3e+03 ... 5.75e+05 6e+05
    ULONG           (nlat, nlon) float64 3MB ...
    ULAT            (nlat, nlon) float64 3MB ...
    TLONG           (nlat, nlon) float64 3MB ...
    TLAT            (nlat, nlon) float64 3MB ...
Dimensions without coordinates: nlat, nlon
Data variables: (12/29)
    TEND_TEMP       (time, z_t, nlat, nlon) float32 98MB ...
    UET             (time, z_t, nlat, nlon) float32 98MB ...
    VNT             (time, z_t, nlat, nlon) float32 98MB ...
    WTT             (time, z_w_top, nlat, nlon) float32 98MB ...
    KPP_SRC_TEMP    (time, z_t, nlat, nlon) float32 98MB ...
    UVEL            (time, z_t, nlat, nlon) float32 98MB ...
    ...              ...
    DIA_IMPVF_TEMP  (time, z_w_bot, nlat, nlon) float32 98MB ...
    SHF             (time, nlat, nlon) float32 2MB ...
    SHF_QSW         (time, nlat, nlon) float32 2MB ...
    DZU             (z_t, nlat, nlon) float32 98MB ...
    DZT             (z_t, nlat, nlon) float32 98MB ...
    SALT            (time, z_t, nlat, nlon) float32 98MB 35.0 35.0 ... 35.0 35.0
Attributes:
    title:             g.e20.G.TL319_t13.control.001_hfreq
    history:           none
    Conventions:       CF-1.0; http://www.cgd.ucar.edu/cms/eaton/netcdf/CF-cu...
    time_period_freq:  day_5
    model_doi_url:     https://doi.org/10.5065/D67H1H0V
    contents:          Diagnostic and Prognostic Variables
    source:            CCSM POP2, the CCSM Ocean Component
    revision:          $Id: tavg.F90 89091 2018-04-30 15:58:32Z altuntas@ucar...
    calendar:          All years have exactly  365 days.
    start_time:        This dataset was created on 2018-12-14 at 16:05:58.8
    cell_methods:      cell_methods = time: mean ==> the variable values are ...
xarray.Dataset
- time: 1
- z_t: 62
- nlat: 305
- nlon: 1301
- z_w_top: 62
- z_w: 62
- z_w_bot: 62
- time(time)object0036-12-07 00:00:00
- long_name :
- time
- bounds :
- time_bound
array([cftime.DatetimeNoLeap(36, 12, 7, 0, 0, 0, 0, has_year_zero=True)], dtype=object) - z_t(z_t)float32500.0 1.5e+03 ... 5.875e+05
- long_name :
- depth from surface to midpoint of layer
- units :
- centimeters
- positive :
- down
- valid_min :
- 500.0
- valid_max :
- 587499.06
array([5.000000e+02, 1.500000e+03, 2.500000e+03, 3.500000e+03, 4.500000e+03, 5.500000e+03, 6.500000e+03, 7.500000e+03, 8.500000e+03, 9.500000e+03, 1.050000e+04, 1.150000e+04, 1.250000e+04, 1.350000e+04, 1.450000e+04, 1.550000e+04, 1.650984e+04, 1.754790e+04, 1.862913e+04, 1.976603e+04, 2.097114e+04, 2.225783e+04, 2.364088e+04, 2.513702e+04, 2.676542e+04, 2.854837e+04, 3.051192e+04, 3.268680e+04, 3.510935e+04, 3.782276e+04, 4.087846e+04, 4.433777e+04, 4.827367e+04, 5.277280e+04, 5.793729e+04, 6.388626e+04, 7.075633e+04, 7.870025e+04, 8.788252e+04, 9.847059e+04, 1.106204e+05, 1.244567e+05, 1.400497e+05, 1.573946e+05, 1.764003e+05, 1.968944e+05, 2.186457e+05, 2.413972e+05, 2.649001e+05, 2.889385e+05, 3.133405e+05, 3.379793e+05, 3.627670e+05, 3.876452e+05, 4.125768e+05, 4.375392e+05, 4.625190e+05, 4.875083e+05, 5.125028e+05, 5.375000e+05, 5.624991e+05, 5.874991e+05], dtype=float32) - z_w(z_w)float320.0 1e+03 ... 5.5e+05 5.75e+05
- long_name :
- depth from surface to top of layer
- units :
- centimeters
- positive :
- down
- valid_min :
- 0.0
- valid_max :
- 574999.06
array([ 0. , 1000. , 2000. , 3000. , 4000. , 5000. , 6000. , 7000. , 8000. , 9000. , 10000. , 11000. , 12000. , 13000. , 14000. , 15000. , 16000. , 17019.682, 18076.129, 19182.125, 20349.932, 21592.344, 22923.312, 24358.453, 25915.58 , 27615.26 , 29481.47 , 31542.373, 33831.227, 36387.473, 39258.047, 42498.887, 46176.656, 50370.688, 55174.91 , 60699.668, 67072.86 , 74439.805, 82960.695, 92804.35 , 104136.82 , 117104.016, 131809.36 , 148290.08 , 166499.2 , 186301.44 , 207487.39 , 229803.9 , 252990.4 , 276809.84 , 301067.06 , 325613.84 , 350344.88 , 375189.2 , 400101.16 , 425052.47 , 450026.06 , 475012. , 500004.7 , 525000.94 , 549999.06 , 574999.06 ], dtype=float32) - z_w_top(z_w_top)float320.0 1e+03 ... 5.5e+05 5.75e+05
- long_name :
- depth from surface to top of layer
- units :
- centimeters
- positive :
- down
- valid_min :
- 0.0
- valid_max :
- 574999.06
array([ 0. , 1000. , 2000. , 3000. , 4000. , 5000. , 6000. , 7000. , 8000. , 9000. , 10000. , 11000. , 12000. , 13000. , 14000. , 15000. , 16000. , 17019.682, 18076.129, 19182.125, 20349.932, 21592.344, 22923.312, 24358.453, 25915.58 , 27615.26 , 29481.47 , 31542.373, 33831.227, 36387.473, 39258.047, 42498.887, 46176.656, 50370.688, 55174.91 , 60699.668, 67072.86 , 74439.805, 82960.695, 92804.35 , 104136.82 , 117104.016, 131809.36 , 148290.08 , 166499.2 , 186301.44 , 207487.39 , 229803.9 , 252990.4 , 276809.84 , 301067.06 , 325613.84 , 350344.88 , 375189.2 , 400101.16 , 425052.47 , 450026.06 , 475012. , 500004.7 , 525000.94 , 549999.06 , 574999.06 ], dtype=float32) - z_w_bot(z_w_bot)float321e+03 2e+03 ... 5.75e+05 6e+05
- long_name :
- depth from surface to bottom of layer
- units :
- centimeters
- positive :
- down
- valid_min :
- 1000.0
- valid_max :
- 599999.06
array([ 1000. , 2000. , 3000. , 4000. , 5000. , 6000. , 7000. , 8000. , 9000. , 10000. , 11000. , 12000. , 13000. , 14000. , 15000. , 16000. , 17019.682, 18076.129, 19182.125, 20349.932, 21592.344, 22923.312, 24358.453, 25915.58 , 27615.26 , 29481.47 , 31542.373, 33831.227, 36387.473, 39258.047, 42498.887, 46176.656, 50370.688, 55174.91 , 60699.668, 67072.86 , 74439.805, 82960.695, 92804.35 , 104136.82 , 117104.016, 131809.36 , 148290.08 , 166499.2 , 186301.44 , 207487.39 , 229803.9 , 252990.4 , 276809.84 , 301067.06 , 325613.84 , 350344.88 , 375189.2 , 400101.16 , 425052.47 , 450026.06 , 475012. , 500004.7 , 525000.94 , 549999.06 , 574999.06 , 599999.06 ], dtype=float32) - ULONG(nlat, nlon)float64...
- long_name :
- array of u-grid longitudes
- units :
- degrees_east
[396805 values with dtype=float64]
- ULAT(nlat, nlon)float64...
- long_name :
- array of u-grid latitudes
- units :
- degrees_north
[396805 values with dtype=float64]
- TLONG(nlat, nlon)float64...
- long_name :
- array of t-grid longitudes
- units :
- degrees_east
[396805 values with dtype=float64]
- TLAT(nlat, nlon)float64...
- long_name :
- array of t-grid latitudes
- units :
- degrees_north
[396805 values with dtype=float64]
- TEND_TEMP(time, z_t, nlat, nlon)float32...
- long_name :
- Tendency of Thickness Weighted TEMP
- units :
- degC/s
- grid_loc :
- 3111
- cell_methods :
- time: mean
[24601910 values with dtype=float32]
- UET(time, z_t, nlat, nlon)float32...
- long_name :
- Flux of Heat in grid-x direction
- units :
- degC/s
- grid_loc :
- 3211
- cell_methods :
- time: mean
[24601910 values with dtype=float32]
- VNT(time, z_t, nlat, nlon)float32...
- long_name :
- Flux of Heat in grid-y direction
- units :
- degC/s
- grid_loc :
- 3121
- cell_methods :
- time: mean
[24601910 values with dtype=float32]
- WTT(time, z_w_top, nlat, nlon)float32...
- long_name :
- Heat Flux Across Top Face
- units :
- degC/s
- grid_loc :
- 3112
- cell_methods :
- time: mean
[24601910 values with dtype=float32]
- KPP_SRC_TEMP(time, z_t, nlat, nlon)float32...
- long_name :
- TEMP tendency from KPP non local mixing term
- units :
- degC/s
- grid_loc :
- 3111
- cell_methods :
- time: mean
[24601910 values with dtype=float32]
- UVEL(time, z_t, nlat, nlon)float32...
- long_name :
- Velocity in grid-x direction
- units :
- centimeter/s
- grid_loc :
- 3221
- cell_methods :
- time: mean
[24601910 values with dtype=float32]
- VVEL(time, z_t, nlat, nlon)float32...
- long_name :
- Velocity in grid-y direction
- units :
- centimeter/s
- grid_loc :
- 3221
- cell_methods :
- time: mean
[24601910 values with dtype=float32]
- WVEL(time, z_w_top, nlat, nlon)float32...
- long_name :
- Vertical Velocity
- units :
- centimeter/s
- grid_loc :
- 3112
- cell_methods :
- time: mean
[24601910 values with dtype=float32]
- TEMP(time, z_t, nlat, nlon)float3226.87 26.86 26.87 ... nan nan nan
- long_name :
- Potential Temperature
- units :
- degC
- grid_loc :
- 3111
- cell_methods :
- time: mean
array([[[[26.87082 , ..., nan], ..., [27.93139 , ..., 27.725992]], ..., [[ nan, ..., nan], ..., [ nan, ..., nan]]]], dtype=float32) - DXT(nlat, nlon)float64...
- long_name :
- x-spacing centered at T points
- units :
- centimeters
[396805 values with dtype=float64]
- DXU(nlat, nlon)float64...
- long_name :
- x-spacing centered at U points
- units :
- centimeters
[396805 values with dtype=float64]
- DYT(nlat, nlon)float64...
- long_name :
- y-spacing centered at T points
- units :
- centimeters
[396805 values with dtype=float64]
- DYU(nlat, nlon)float64...
- long_name :
- y-spacing centered at U points
- units :
- centimeters
[396805 values with dtype=float64]
- TAREA(nlat, nlon)float64...
- long_name :
- area of T cells
- units :
- centimeter^2
[396805 values with dtype=float64]
- UAREA(nlat, nlon)float64...
- long_name :
- area of U cells
- units :
- centimeter^2
[396805 values with dtype=float64]
- QSW_3D(time, z_w_top, nlat, nlon)float32...
- long_name :
- Solar Short-Wave Heat Flux
- units :
- watt/m^2
- grid_loc :
- 3112
- cell_methods :
- time: mean
[24601910 values with dtype=float32]
- HDIFE_TEMP(time, z_t, nlat, nlon)float32...
- long_name :
- TEMP Horizontal Diffusive Flux in grid-x direction
- units :
- degC/s
- grid_loc :
- 3211
- cell_methods :
- time: mean
[24601910 values with dtype=float32]
- HDIFN_TEMP(time, z_t, nlat, nlon)float32...
- long_name :
- TEMP Horizontal Diffusive Flux in grid-y direction
- units :
- degC/s
- grid_loc :
- 3121
- cell_methods :
- time: mean
[24601910 values with dtype=float32]
- dz(z_t)float32...
- long_name :
- thickness of layer k
- units :
- centimeters
[62 values with dtype=float32]
- dzw(z_w)float32...
- long_name :
- midpoint of k to midpoint of k+1
- units :
- centimeters
[62 values with dtype=float32]
- hflux_factor()float64...
- long_name :
- Convert Heat and Solar Flux to Temperature Flux
[1 values with dtype=float64]
- KMT(nlat, nlon)float64...
- long_name :
- k Index of Deepest Grid Cell on T Grid
[396805 values with dtype=float64]
- KMU(nlat, nlon)float64...
- long_name :
- k Index of Deepest Grid Cell on U Grid
[396805 values with dtype=float64]
- DIA_IMPVF_TEMP(time, z_w_bot, nlat, nlon)float32...
- long_name :
- TEMP Flux Across Bottom Face from Diabatic Implicit Vertical Mixing
- units :
- degC cm/s
- grid_loc :
- 3113
- cell_methods :
- time: mean
[24601910 values with dtype=float32]
- SHF(time, nlat, nlon)float32...
- long_name :
- Total Surface Heat Flux, Including SW
- units :
- watt/m^2
- grid_loc :
- 2110
- cell_methods :
- time: mean
[396805 values with dtype=float32]
- SHF_QSW(time, nlat, nlon)float32...
- long_name :
- Solar Short-Wave Heat Flux
- units :
- watt/m^2
- grid_loc :
- 2110
- cell_methods :
- time: mean
[396805 values with dtype=float32]
- DZU(z_t, nlat, nlon)float32...
- longname :
- U-grid cell thickness
- units :
- cm
[24601910 values with dtype=float32]
- DZT(z_t, nlat, nlon)float32...
- longname :
- T-grid cell thickness
- units :
- cm
[24601910 values with dtype=float32]
- SALT(time, z_t, nlat, nlon)float3235.0 35.0 35.0 ... 35.0 35.0 35.0
- grid_loc :
- 3111
array([[[[35., 35., 35., ..., 35., 35., 35.],
         [35., 35., 35., ..., 35., 35., 35.],
         [35., 35., 35., ..., 35., 35., 35.],
         ...,
         [35., 35., 35., ..., 35., 35., 35.],
         [35., 35., 35., ..., 35., 35., 35.],
         [35., 35., 35., ..., 35., 35., 35.]],

        [[35., 35., 35., ..., 35., 35., 35.],
         [35., 35., 35., ..., 35., 35., 35.],
         [35., 35., 35., ..., 35., 35., 35.],
         ...,
         [35., 35., 35., ..., 35., 35., 35.],
         [35., 35., 35., ..., 35., 35., 35.],
         [35., 35., 35., ..., 35., 35., 35.]],

        [[35., 35., 35., ..., 35., 35., 35.],
         [35., 35., 35., ..., 35., 35., 35.],
         [35., 35., 35., ..., 35., 35., 35.],
         ...,
...
         ...,
         [35., 35., 35., ..., 35., 35., 35.],
         [35., 35., 35., ..., 35., 35., 35.],
         [35., 35., 35., ..., 35., 35., 35.]],

        [[35., 35., 35., ..., 35., 35., 35.],
         [35., 35., 35., ..., 35., 35., 35.],
         [35., 35., 35., ..., 35., 35., 35.],
         ...,
         [35., 35., 35., ..., 35., 35., 35.],
         [35., 35., 35., ..., 35., 35., 35.],
         [35., 35., 35., ..., 35., 35., 35.]],

        [[35., 35., 35., ..., 35., 35., 35.],
         [35., 35., 35., ..., 35., 35., 35.],
         [35., 35., 35., ..., 35., 35., 35.],
         ...,
         [35., 35., 35., ..., 35., 35., 35.],
         [35., 35., 35., ..., 35., 35., 35.],
         [35., 35., 35., ..., 35., 35., 35.]]]], dtype=float32)
- timePandasIndex
PandasIndex(CFTimeIndex([0036-12-07 00:00:00], dtype='object', length=1, calendar='noleap', freq=None)) - z_tPandasIndex
PandasIndex(Index([ 500.0, 1500.0, 2500.0, 3500.0, 4500.0, 5500.0, 6500.0, 7500.0, 8500.0, 9500.0, 10500.0, 11500.0, 12500.0, 13500.0, 14500.0, 15500.0, 16509.83984375, 17547.904296875, 18629.126953125, 19766.02734375, 20971.138671875, 22257.828125, 23640.8828125, 25137.015625, 26765.419921875, 28548.365234375, 30511.921875, 32686.798828125, 35109.34765625, 37822.76171875, 40878.46484375, 44337.76953125, 48273.671875, 52772.80078125, 57937.2890625, 63886.26171875, 70756.328125, 78700.25, 87882.5234375, 98470.5859375, 110620.421875, 124456.6875, 140049.71875, 157394.640625, 176400.328125, 196894.421875, 218645.65625, 241397.15625, 264900.125, 288938.46875, 313340.46875, 337979.34375, 362767.03125, 387645.1875, 412576.8125, 437539.25, 462519.03125, 487508.34375, 512502.8125, 537500.0, 562499.0625, 587499.0625], dtype='float32', name='z_t')) - z_wPandasIndex
PandasIndex(Index([ 0.0, 1000.0, 2000.0, 3000.0, 4000.0, 5000.0, 6000.0, 7000.0, 8000.0, 9000.0, 10000.0, 11000.0, 12000.0, 13000.0, 14000.0, 15000.0, 16000.0, 17019.681640625, 18076.12890625, 19182.125, 20349.931640625, 21592.34375, 22923.3125, 24358.453125, 25915.580078125, 27615.259765625, 29481.470703125, 31542.373046875, 33831.2265625, 36387.47265625, 39258.046875, 42498.88671875, 46176.65625, 50370.6875, 55174.91015625, 60699.66796875, 67072.859375, 74439.8046875, 82960.6953125, 92804.3515625, 104136.8203125, 117104.015625, 131809.359375, 148290.078125, 166499.203125, 186301.4375, 207487.390625, 229803.90625, 252990.40625, 276809.84375, 301067.0625, 325613.84375, 350344.875, 375189.1875, 400101.15625, 425052.46875, 450026.0625, 475012.0, 500004.6875, 525000.9375, 549999.0625, 574999.0625], dtype='float32', name='z_w')) - z_w_topPandasIndex
PandasIndex(Index([ 0.0, 1000.0, 2000.0, 3000.0, 4000.0, 5000.0, 6000.0, 7000.0, 8000.0, 9000.0, 10000.0, 11000.0, 12000.0, 13000.0, 14000.0, 15000.0, 16000.0, 17019.681640625, 18076.12890625, 19182.125, 20349.931640625, 21592.34375, 22923.3125, 24358.453125, 25915.580078125, 27615.259765625, 29481.470703125, 31542.373046875, 33831.2265625, 36387.47265625, 39258.046875, 42498.88671875, 46176.65625, 50370.6875, 55174.91015625, 60699.66796875, 67072.859375, 74439.8046875, 82960.6953125, 92804.3515625, 104136.8203125, 117104.015625, 131809.359375, 148290.078125, 166499.203125, 186301.4375, 207487.390625, 229803.90625, 252990.40625, 276809.84375, 301067.0625, 325613.84375, 350344.875, 375189.1875, 400101.15625, 425052.46875, 450026.0625, 475012.0, 500004.6875, 525000.9375, 549999.0625, 574999.0625], dtype='float32', name='z_w_top')) - z_w_botPandasIndex
PandasIndex(Index([         1000.0,          2000.0,          3000.0,          4000.0,
                5000.0,          6000.0,          7000.0,          8000.0,
                9000.0,         10000.0,         11000.0,         12000.0,
               13000.0,         14000.0,         15000.0,         16000.0,
       17019.681640625,  18076.12890625,       19182.125, 20349.931640625,
           21592.34375,      22923.3125,    24358.453125, 25915.580078125,
       27615.259765625, 29481.470703125, 31542.373046875,   33831.2265625,
        36387.47265625,    39258.046875,  42498.88671875,     46176.65625,
            50370.6875,  55174.91015625,  60699.66796875,    67072.859375,
         74439.8046875,   82960.6953125,   92804.3515625,  104136.8203125,
         117104.015625,   131809.359375,   148290.078125,   166499.203125,
           186301.4375,   207487.390625,    229803.90625,    252990.40625,
          276809.84375,     301067.0625,    325613.84375,      350344.875,
           375189.1875,    400101.15625,    425052.46875,     450026.0625,
              475012.0,     500004.6875,     525000.9375,     549999.0625,
           574999.0625,     599999.0625],
      dtype='float32', name='z_w_bot'))
- title :
- g.e20.G.TL319_t13.control.001_hfreq
- history :
- none
- Conventions :
- CF-1.0; http://www.cgd.ucar.edu/cms/eaton/netcdf/CF-current.htm
- time_period_freq :
- day_5
- model_doi_url :
- https://doi.org/10.5065/D67H1H0V
- contents :
- Diagnostic and Prognostic Variables
- source :
- CCSM POP2, the CCSM Ocean Component
- revision :
- $Id: tavg.F90 89091 2018-04-30 15:58:32Z altuntas@ucar.edu $
- calendar :
- All years have exactly 365 days.
- start_time :
- This dataset was created on 2018-12-14 at 16:05:58.8
- cell_methods :
- cell_methods = time: mean ==> the variable values are averaged over the time interval between the previous time coordinate and the current one. cell_methods absent ==> the variable values are at the time given by the current time coordinate.
Construct xgcm-compatible dataset and xgcm grid object#
metrics = {
    ("X",): ["DXU", "DXT"],  # X distances
    ("Y",): ["DYU", "DYT"],  # Y distances
    ("Z",): ["DZU", "DZT"],  # Z distances
    ("X", "Y"): ["UAREA", "TAREA"],
}

# here we get the xgcm compatible dataset
grid, xds = pop_tools.to_xgcm_grid_dataset(
    ds,
    periodic=False,
    metrics=metrics,
    boundary={"X": "extend", "Y": "extend", "Z": "extend"},
)

xds["rho"] = pop_tools.eos(xds.SALT, xds.TEMP, depth=xds.z_t * 1e-2)
xds
<xarray.Dataset> Size: 2GB
Dimensions:         (time: 1, z_t: 62, nlat_t: 305, nlon_t: 1301, nlon_u: 1301,
                     nlat_u: 305, z_w_top: 62, z_w_bot: 62)
Coordinates:
  * time            (time) object 8B 0036-12-07 00:00:00
  * z_t             (z_t) float32 248B 500.0 1.5e+03 ... 5.625e+05 5.875e+05
  * z_w_top         (z_w_top) float32 248B 0.0 1e+03 2e+03 ... 5.5e+05 5.75e+05
  * z_w_bot         (z_w_bot) float32 248B 1e+03 2e+03 3e+03 ... 5.75e+05 6e+05
    ULONG           (nlat_u, nlon_u) float64 3MB 160.0 160.1 ... -70.1 -70.0
    ULAT            (nlat_u, nlon_u) float64 3MB -15.03 -15.03 ... 15.03 15.03
    TLONG           (nlat_t, nlon_t) float64 3MB 159.9 160.0 ... 289.9 290.0
    TLAT            (nlat_t, nlon_t) float64 3MB -15.07 -15.07 ... 14.98 14.98
  * nlon_u          (nlon_u) int64 10kB 1 2 3 4 5 6 ... 1297 1298 1299 1300 1301
  * nlat_u          (nlat_u) int64 2kB 1 2 3 4 5 6 7 ... 300 301 302 303 304 305
  * nlon_t          (nlon_t) float64 10kB 0.5 1.5 2.5 ... 1.3e+03 1.3e+03
  * nlat_t          (nlat_t) float64 2kB 0.5 1.5 2.5 3.5 ... 302.5 303.5 304.5
Data variables: (12/30)
    TEND_TEMP       (time, z_t, nlat_t, nlon_t) float32 98MB 3.461e-08 ... nan
    UET             (time, z_t, nlat_t, nlon_u) float32 98MB -0.0005898 ... 0.0
    VNT             (time, z_t, nlat_u, nlon_t) float32 98MB 0.0002135 ... 0.0
    WTT             (time, z_w_top, nlat_t, nlon_t) float32 98MB 0.0 0.0 ... nan
    KPP_SRC_TEMP    (time, z_t, nlat_t, nlon_t) float32 98MB 1.908e-06 ... nan
    UVEL            (time, z_t, nlat_u, nlon_u) float32 98MB -23.85 ... nan
    ...              ...
    SHF             (time, nlat_t, nlon_t) float32 2MB 94.64 96.18 ... -58.65
    SHF_QSW         (time, nlat_t, nlon_t) float32 2MB 245.0 245.2 ... 203.9
    DZU             (z_t, nlat_u, nlon_u) float32 98MB 1e+03 1e+03 ... 2.5e+04
    DZT             (z_t, nlat_t, nlon_t) float32 98MB 1e+03 1e+03 ... 2.5e+04
    SALT            (time, z_t, nlat_t, nlon_t) float32 98MB 35.0 35.0 ... 35.0
    rho             (time, z_t, nlat_t, nlon_t) float64 197MB 1.023e+03 ... nan
Attributes:
    title:             g.e20.G.TL319_t13.control.001_hfreq
    history:           none
    Conventions:       CF-1.0; http://www.cgd.ucar.edu/cms/eaton/netcdf/CF-cu...
    time_period_freq:  day_5
    model_doi_url:     https://doi.org/10.5065/D67H1H0V
    contents:          Diagnostic and Prognostic Variables
    source:            CCSM POP2, the CCSM Ocean Component
    revision:          $Id: tavg.F90 89091 2018-04-30 15:58:32Z altuntas@ucar...
    calendar:          All years have exactly  365 days.
    start_time:        This dataset was created on 2018-12-14 at 16:05:58.8
    cell_methods:      cell_methods = time: mean ==> the variable values are ...
xarray.Dataset
- time: 1
- z_t: 62
- nlat_t: 305
- nlon_t: 1301
- nlon_u: 1301
- nlat_u: 305
- z_w_top: 62
- z_w_bot: 62
- time(time)object0036-12-07 00:00:00
array([cftime.DatetimeNoLeap(36, 12, 7, 0, 0, 0, 0, has_year_zero=True)], dtype=object) - z_t(z_t)float32500.0 1.5e+03 ... 5.875e+05
array([5.000000e+02, 1.500000e+03, 2.500000e+03, 3.500000e+03, 4.500000e+03, 5.500000e+03, 6.500000e+03, 7.500000e+03, 8.500000e+03, 9.500000e+03, 1.050000e+04, 1.150000e+04, 1.250000e+04, 1.350000e+04, 1.450000e+04, 1.550000e+04, 1.650984e+04, 1.754790e+04, 1.862913e+04, 1.976603e+04, 2.097114e+04, 2.225783e+04, 2.364088e+04, 2.513702e+04, 2.676542e+04, 2.854837e+04, 3.051192e+04, 3.268680e+04, 3.510935e+04, 3.782276e+04, 4.087846e+04, 4.433777e+04, 4.827367e+04, 5.277280e+04, 5.793729e+04, 6.388626e+04, 7.075633e+04, 7.870025e+04, 8.788252e+04, 9.847059e+04, 1.106204e+05, 1.244567e+05, 1.400497e+05, 1.573946e+05, 1.764003e+05, 1.968944e+05, 2.186457e+05, 2.413972e+05, 2.649001e+05, 2.889385e+05, 3.133405e+05, 3.379793e+05, 3.627670e+05, 3.876452e+05, 4.125768e+05, 4.375392e+05, 4.625190e+05, 4.875083e+05, 5.125028e+05, 5.375000e+05, 5.624991e+05, 5.874991e+05], dtype=float32) - z_w_top(z_w_top)float320.0 1e+03 ... 5.5e+05 5.75e+05
- long_name :
- depth from surface to top of layer
- units :
- centimeters
- positive :
- down
- valid_min :
- 0.0
- valid_max :
- 574999.06
- axis :
- Z
- c_grid_axis_shift :
- -0.5
array([ 0. , 1000. , 2000. , 3000. , 4000. , 5000. , 6000. , 7000. , 8000. , 9000. , 10000. , 11000. , 12000. , 13000. , 14000. , 15000. , 16000. , 17019.682, 18076.129, 19182.125, 20349.932, 21592.344, 22923.312, 24358.453, 25915.58 , 27615.26 , 29481.47 , 31542.373, 33831.227, 36387.473, 39258.047, 42498.887, 46176.656, 50370.688, 55174.91 , 60699.668, 67072.86 , 74439.805, 82960.695, 92804.35 , 104136.82 , 117104.016, 131809.36 , 148290.08 , 166499.2 , 186301.44 , 207487.39 , 229803.9 , 252990.4 , 276809.84 , 301067.06 , 325613.84 , 350344.88 , 375189.2 , 400101.16 , 425052.47 , 450026.06 , 475012. , 500004.7 , 525000.94 , 549999.06 , 574999.06 ], dtype=float32) - z_w_bot(z_w_bot)float321e+03 2e+03 ... 5.75e+05 6e+05
- long_name :
- depth from surface to bottom of layer
- units :
- centimeters
- positive :
- down
- valid_min :
- 1000.0
- valid_max :
- 599999.06
- axis :
- Z
- c_grid_axis_shift :
- 0.5
array([ 1000. , 2000. , 3000. , 4000. , 5000. , 6000. , 7000. , 8000. , 9000. , 10000. , 11000. , 12000. , 13000. , 14000. , 15000. , 16000. , 17019.682, 18076.129, 19182.125, 20349.932, 21592.344, 22923.312, 24358.453, 25915.58 , 27615.26 , 29481.47 , 31542.373, 33831.227, 36387.473, 39258.047, 42498.887, 46176.656, 50370.688, 55174.91 , 60699.668, 67072.86 , 74439.805, 82960.695, 92804.35 , 104136.82 , 117104.016, 131809.36 , 148290.08 , 166499.2 , 186301.44 , 207487.39 , 229803.9 , 252990.4 , 276809.84 , 301067.06 , 325613.84 , 350344.88 , 375189.2 , 400101.16 , 425052.47 , 450026.06 , 475012. , 500004.7 , 525000.94 , 549999.06 , 574999.06 , 599999.06 ], dtype=float32) - ULONG(nlat_u, nlon_u)float64160.0 160.1 160.2 ... -70.1 -70.0
- long_name :
- array of u-grid longitudes
- units :
- degrees_east
- grid_loc :
- 2220
array([[160. , 160.1, 160.2, ..., -70.2, -70.1, -70. ], [160. , 160.1, 160.2, ..., -70.2, -70.1, -70. ], [160. , 160.1, 160.2, ..., -70.2, -70.1, -70. ], ..., [160. , 160.1, 160.2, ..., -70.2, -70.1, -70. ], [160. , 160.1, 160.2, ..., -70.2, -70.1, -70. ], [160. , 160.1, 160.2, ..., -70.2, -70.1, -70. ]]) - ULAT(nlat_u, nlon_u)float64-15.03 -15.03 ... 15.03 15.03
- long_name :
- array of u-grid latitudes
- units :
- degrees_north
- grid_loc :
- 2220
array([[-15.02645786, -15.02645786, -15.02645786, ..., -15.02645786, -15.02645786, -15.02645786], [-14.92983365, -14.92983365, -14.92983365, ..., -14.92983365, -14.92983365, -14.92983365], [-14.83316612, -14.83316612, -14.83316612, ..., -14.83316612, -14.83316612, -14.83316612], ..., [ 14.83316612, 14.83316612, 14.83316612, ..., 14.83316612, 14.83316612, 14.83316612], [ 14.92983365, 14.92983365, 14.92983365, ..., 14.92983365, 14.92983365, 14.92983365], [ 15.02645786, 15.02645786, 15.02645786, ..., 15.02645786, 15.02645786, 15.02645786]]) - TLONG(nlat_t, nlon_t)float64159.9 160.0 160.1 ... 289.9 290.0
- long_name :
- array of t-grid longitudes
- units :
- degrees_east
- grid_loc :
- 2110
array([[159.95, 160.05, 160.15, ..., 289.75, 289.85, 289.95], [159.95, 160.05, 160.15, ..., 289.75, 289.85, 289.95], [159.95, 160.05, 160.15, ..., 289.75, 289.85, 289.95], ..., [159.95, 160.05, 160.15, ..., 289.75, 289.85, 289.95], [159.95, 160.05, 160.15, ..., 289.75, 289.85, 289.95], [159.95, 160.05, 160.15, ..., 289.75, 289.85, 289.95]]) - TLAT(nlat_t, nlon_t)float64-15.07 -15.07 ... 14.98 14.98
- long_name :
- array of t-grid latitudes
- units :
- degrees_north
- grid_loc :
- 2110
array([[-15.07475365, -15.07475365, -15.07475365, ..., -15.07475365, -15.07475365, -15.07475365], [-14.9781512 , -14.9781512 , -14.9781512 , ..., -14.9781512 , -14.9781512 , -14.9781512 ], [-14.8815053 , -14.8815053 , -14.8815053 , ..., -14.8815053 , -14.8815053 , -14.8815053 ], ..., [ 14.7848162 , 14.7848162 , 14.7848162 , ..., 14.7848162 , 14.7848162 , 14.7848162 ], [ 14.8815053 , 14.8815053 , 14.8815053 , ..., 14.8815053 , 14.8815053 , 14.8815053 ], [ 14.9781512 , 14.9781512 , 14.9781512 , ..., 14.9781512 , 14.9781512 , 14.9781512 ]]) - nlon_u(nlon_u)int641 2 3 4 5 ... 1298 1299 1300 1301
- axis :
- X
- c_grid_axis_shift :
- 0.5
array([ 1, 2, 3, ..., 1299, 1300, 1301])
- nlat_u(nlat_u)int641 2 3 4 5 6 ... 301 302 303 304 305
- axis :
- Y
- c_grid_axis_shift :
- 0.5
array([ 1, 2, 3, ..., 303, 304, 305])
- nlon_t(nlon_t)float640.5 1.5 2.5 ... 1.3e+03 1.3e+03
array([5.0000e-01, 1.5000e+00, 2.5000e+00, ..., 1.2985e+03, 1.2995e+03, 1.3005e+03]) - nlat_t(nlat_t)float640.5 1.5 2.5 ... 302.5 303.5 304.5
array([ 0.5, 1.5, 2.5, ..., 302.5, 303.5, 304.5])
- TEND_TEMP(time, z_t, nlat_t, nlon_t)float323.461e-08 1.807e-07 ... nan nan
- long_name :
- Tendency of Thickness Weighted TEMP
- units :
- degC/s
- grid_loc :
- 3111
- cell_methods :
- time: mean
array([[[[ 3.46056268e-08, 1.80671279e-07, 3.91672614e-07, ..., nan, nan, nan], [ 1.07943237e-07, 2.19586965e-07, 4.52391362e-07, ..., nan, nan, nan], [ 1.87353976e-07, 2.62796334e-07, 4.38701051e-07, ..., nan, nan, nan], ..., [-5.05511139e-07, -5.02081321e-07, -4.98360805e-07, ..., -3.52250538e-07, -3.63505791e-07, -3.83077492e-07], [-4.98683903e-07, -5.19817377e-07, -5.05030414e-07, ..., -4.38479049e-07, -4.63021735e-07, -4.81695849e-07], [-4.76793872e-07, -5.49971105e-07, -5.56377131e-07, ..., -6.85790781e-07, -6.69126791e-07, -6.57019712e-07]], [[ 5.79335122e-08, 2.13767976e-07, 4.34827967e-07, ..., nan, nan, nan], [ 1.49679650e-07, 2.73230540e-07, 5.11472706e-07, ..., nan, nan, nan], [ 2.54681225e-07, 3.41973958e-07, 5.21864706e-07, ..., nan, nan, nan], ... nan, nan, nan], [ nan, nan, nan, ..., nan, nan, nan], [ nan, nan, nan, ..., nan, nan, nan]], [[ nan, nan, nan, ..., nan, nan, nan], [ nan, nan, nan, ..., nan, nan, nan], [ nan, nan, nan, ..., nan, nan, nan], ..., [ nan, nan, nan, ..., nan, nan, nan], [ nan, nan, nan, ..., nan, nan, nan], [ nan, nan, nan, ..., nan, nan, nan]]]], dtype=float32) - UET(time, z_t, nlat_t, nlon_u)float32-0.0005898 -0.0006306 ... 0.0 0.0
- long_name :
- Flux of Heat in grid-x direction
- units :
- degC/s
- grid_loc :
- 3211
- cell_methods :
- time: mean
array([[[[-5.8981479e-04, -6.3058845e-04, -6.4141728e-04, ..., 0.0000000e+00, 0.0000000e+00, 0.0000000e+00], [-5.9510104e-04, -6.1750511e-04, -6.0868193e-04, ..., 0.0000000e+00, 0.0000000e+00, 0.0000000e+00], [-5.8199256e-04, -5.8142096e-04, -5.5241393e-04, ..., 0.0000000e+00, 0.0000000e+00, 0.0000000e+00], ..., [-4.2903060e-04, -4.3390927e-04, -4.3888713e-04, ..., -6.2893907e-04, -5.6909444e-04, -5.1800814e-04], [-4.1530357e-04, -4.1823235e-04, -4.2217842e-04, ..., -5.8426487e-04, -5.2095583e-04, -4.6718909e-04], [-4.0400936e-04, -4.0720709e-04, -4.1103581e-04, ..., -4.5888204e-04, -3.8409504e-04, -3.2267402e-04]], [[-4.7394997e-04, -5.1249319e-04, -5.2131998e-04, ..., 0.0000000e+00, 0.0000000e+00, 0.0000000e+00], [-4.7892897e-04, -4.9894466e-04, -4.8816449e-04, ..., 0.0000000e+00, 0.0000000e+00, 0.0000000e+00], [-4.6519880e-04, -4.6245463e-04, -4.3177954e-04, ..., 0.0000000e+00, 0.0000000e+00, 0.0000000e+00], ... 0.0000000e+00, 0.0000000e+00, 0.0000000e+00], [ 0.0000000e+00, 0.0000000e+00, 0.0000000e+00, ..., 0.0000000e+00, 0.0000000e+00, 0.0000000e+00], [ 0.0000000e+00, 0.0000000e+00, 0.0000000e+00, ..., 0.0000000e+00, 0.0000000e+00, 0.0000000e+00]], [[ 0.0000000e+00, 0.0000000e+00, 0.0000000e+00, ..., 0.0000000e+00, 0.0000000e+00, 0.0000000e+00], [ 0.0000000e+00, 0.0000000e+00, 0.0000000e+00, ..., 0.0000000e+00, 0.0000000e+00, 0.0000000e+00], [ 0.0000000e+00, 0.0000000e+00, 0.0000000e+00, ..., 0.0000000e+00, 0.0000000e+00, 0.0000000e+00], ..., [ 0.0000000e+00, 0.0000000e+00, 0.0000000e+00, ..., 0.0000000e+00, 0.0000000e+00, 0.0000000e+00], [ 0.0000000e+00, 0.0000000e+00, 0.0000000e+00, ..., 0.0000000e+00, 0.0000000e+00, 0.0000000e+00], [ 0.0000000e+00, 0.0000000e+00, 0.0000000e+00, ..., 0.0000000e+00, 0.0000000e+00, 0.0000000e+00]]]], dtype=float32) - VNT(time, z_t, nlat_u, nlon_t)float320.0002135 0.0003014 ... 0.0 0.0
- long_name :
- Flux of Heat in grid-y direction
- units :
- degC/s
- grid_loc :
- 3121
- cell_methods :
- time: mean
array([[[[2.1350103e-04, 3.0143379e-04, 3.7243063e-04, ..., 0.0000000e+00, 0.0000000e+00, 0.0000000e+00], [2.5610928e-04, 3.2313386e-04, 3.6535595e-04, ..., 0.0000000e+00, 0.0000000e+00, 0.0000000e+00], [2.7839895e-04, 3.2335037e-04, 3.3868832e-04, ..., 0.0000000e+00, 0.0000000e+00, 0.0000000e+00], ..., [2.1069360e-04, 2.0842761e-04, 2.0460520e-04, ..., 1.8333115e-04, 1.3123237e-04, 9.0971334e-05], [2.1445459e-04, 2.1139412e-04, 2.0719666e-04, ..., 9.8215547e-05, 5.9192793e-05, 3.2206332e-05], [2.2025200e-04, 2.1503893e-04, 2.0926520e-04, ..., 4.4906563e-05, 2.3912924e-05, 1.5640782e-05]], [[1.9981392e-04, 2.8854058e-04, 3.6127935e-04, ..., 0.0000000e+00, 0.0000000e+00, 0.0000000e+00], [2.4306485e-04, 3.1127012e-04, 3.5545565e-04, ..., 0.0000000e+00, 0.0000000e+00, 0.0000000e+00], [2.6624816e-04, 3.1270451e-04, 3.3004224e-04, ..., 0.0000000e+00, 0.0000000e+00, 0.0000000e+00], ... [0.0000000e+00, 0.0000000e+00, 0.0000000e+00, ..., 0.0000000e+00, 0.0000000e+00, 0.0000000e+00], [0.0000000e+00, 0.0000000e+00, 0.0000000e+00, ..., 0.0000000e+00, 0.0000000e+00, 0.0000000e+00], [0.0000000e+00, 0.0000000e+00, 0.0000000e+00, ..., 0.0000000e+00, 0.0000000e+00, 0.0000000e+00]], [[0.0000000e+00, 0.0000000e+00, 0.0000000e+00, ..., 0.0000000e+00, 0.0000000e+00, 0.0000000e+00], [0.0000000e+00, 0.0000000e+00, 0.0000000e+00, ..., 0.0000000e+00, 0.0000000e+00, 0.0000000e+00], [0.0000000e+00, 0.0000000e+00, 0.0000000e+00, ..., 0.0000000e+00, 0.0000000e+00, 0.0000000e+00], ..., [0.0000000e+00, 0.0000000e+00, 0.0000000e+00, ..., 0.0000000e+00, 0.0000000e+00, 0.0000000e+00], [0.0000000e+00, 0.0000000e+00, 0.0000000e+00, ..., 0.0000000e+00, 0.0000000e+00, 0.0000000e+00], [0.0000000e+00, 0.0000000e+00, 0.0000000e+00, ..., 0.0000000e+00, 0.0000000e+00, 0.0000000e+00]]]], dtype=float32) - WTT(time, z_w_top, nlat_t, nlon_t)float320.0 0.0 0.0 0.0 ... nan nan nan nan
- long_name :
- Heat Flux Across Top Face
- units :
- degC/s
- grid_loc :
- 3112
- cell_methods :
- time: mean
array([[[[ 0.0000000e+00, 0.0000000e+00, 0.0000000e+00, ..., nan, nan, nan], [ 0.0000000e+00, 0.0000000e+00, 0.0000000e+00, ..., nan, nan, nan], [ 0.0000000e+00, 0.0000000e+00, 0.0000000e+00, ..., nan, nan, nan], ..., [ 0.0000000e+00, 0.0000000e+00, 0.0000000e+00, ..., 0.0000000e+00, 0.0000000e+00, 0.0000000e+00], [ 0.0000000e+00, 0.0000000e+00, 0.0000000e+00, ..., 0.0000000e+00, 0.0000000e+00, 0.0000000e+00], [ 0.0000000e+00, 0.0000000e+00, 0.0000000e+00, ..., 0.0000000e+00, 0.0000000e+00, 0.0000000e+00]], [[-1.8136426e-06, 4.5334463e-07, 2.2615798e-06, ..., nan, nan, nan], [-1.9421007e-06, -5.4907474e-07, 2.2240058e-06, ..., nan, nan, nan], [-7.2046146e-07, 9.9928832e-07, 2.7894878e-06, ..., nan, nan, nan], ... nan, nan, nan], [ nan, nan, nan, ..., nan, nan, nan], [ nan, nan, nan, ..., nan, nan, nan]], [[ nan, nan, nan, ..., nan, nan, nan], [ nan, nan, nan, ..., nan, nan, nan], [ nan, nan, nan, ..., nan, nan, nan], ..., [ nan, nan, nan, ..., nan, nan, nan], [ nan, nan, nan, ..., nan, nan, nan], [ nan, nan, nan, ..., nan, nan, nan]]]], dtype=float32) - KPP_SRC_TEMP(time, z_t, nlat_t, nlon_t)float321.908e-06 1.893e-06 ... nan nan
- long_name :
- TEMP tendency from KPP non local mixing term
- units :
- degC/s
- grid_loc :
- 3111
- cell_methods :
- time: mean
array([[[[ 1.9081156e-06, 1.8931496e-06, 1.8960266e-06, ..., nan, nan, nan], [ 1.9311058e-06, 1.9211293e-06, 1.9011511e-06, ..., nan, nan, nan], [ 1.9428837e-06, 1.9275881e-06, 1.8980155e-06, ..., nan, nan, nan], ..., [ 3.3589786e-06, 3.3521228e-06, 3.3574988e-06, ..., 3.4062562e-06, 3.3715301e-06, 3.3560254e-06], [ 3.3741817e-06, 3.3580829e-06, 3.3415474e-06, ..., 3.2377363e-06, 3.2162511e-06, 3.2016746e-06], [ 3.4094669e-06, 3.3413685e-06, 3.3148640e-06, ..., 3.2443781e-06, 3.2285154e-06, 3.2340224e-06]], [[-8.3198194e-07, -9.2617216e-07, -1.0746325e-06, ..., nan, nan, nan], [-9.6195481e-07, -1.1010576e-06, -1.2223530e-06, ..., nan, nan, nan], [-1.1061006e-06, -1.2426525e-06, -1.3450500e-06, ..., nan, nan, nan], ... nan, nan, nan], [ nan, nan, nan, ..., nan, nan, nan], [ nan, nan, nan, ..., nan, nan, nan]], [[ nan, nan, nan, ..., nan, nan, nan], [ nan, nan, nan, ..., nan, nan, nan], [ nan, nan, nan, ..., nan, nan, nan], ..., [ nan, nan, nan, ..., nan, nan, nan], [ nan, nan, nan, ..., nan, nan, nan], [ nan, nan, nan, ..., nan, nan, nan]]]], dtype=float32) - UVEL(time, z_t, nlat_u, nlon_u)float32-23.85 -25.17 -25.21 ... nan nan
- long_name :
- Velocity in grid-x direction
- units :
- centimeter/s
- grid_loc :
- 3221
- cell_methods :
- time: mean
array([[[[-23.847055 , -25.16644 , -25.207188 , ..., nan, nan, nan], [-23.674194 , -24.12648 , -23.336342 , ..., nan, nan, nan], [-22.778587 , -22.259188 , -20.696669 , ..., nan, nan, nan], ..., [-16.224794 , -16.356735 , -16.52335 , ..., -24.132261 , -21.900045 , -19.957563 ], [-15.722776 , -15.823919 , -15.971273 , ..., -21.053026 , -18.39876 , -16.18444 ], [-15.349255 , -15.505581 , -15.668845 , ..., -14.479387 , -11.345076 , -8.803285 ]], [[-19.238626 , -20.463634 , -20.428509 , ..., nan, nan, nan], [-19.051489 , -19.41288 , -18.551231 , ..., nan, nan, nan], [-18.12522 , -17.527023 , -15.908432 , ..., nan, nan, nan], ... [ nan, nan, nan, ..., nan, nan, nan], [ nan, nan, nan, ..., nan, nan, nan], [ nan, nan, nan, ..., nan, nan, nan]], [[ nan, nan, nan, ..., nan, nan, nan], [ nan, nan, nan, ..., nan, nan, nan], [ nan, nan, nan, ..., nan, nan, nan], ..., [ nan, nan, nan, ..., nan, nan, nan], [ nan, nan, nan, ..., nan, nan, nan], [ nan, nan, nan, ..., nan, nan, nan]]]], dtype=float32) - VVEL(time, z_t, nlat_u, nlon_u)float3210.3 13.78 15.95 ... nan nan nan
- long_name :
- Velocity in grid-y direction
- units :
- centimeter/s
- grid_loc :
- 3221
- cell_methods :
- time: mean
array([[[[10.3000965 , 13.77956 , 15.953891 , ..., nan, nan, nan], [11.688542 , 14.112952 , 15.041122 , ..., nan, nan, nan], [12.2102375 , 13.598565 , 13.419611 , ..., nan, nan, nan], ..., [ 8.0788145 , 7.964908 , 7.7867136 , ..., 5.961892 , 4.1783137 , 2.8519673 ], [ 8.20122 , 8.068523 , 7.8838167 , ..., 2.920298 , 1.6612542 , 0.8307241 ], [ 8.376501 , 8.167209 , 7.94016 , ..., 1.1996826 , 0.6480607 , 0.56002045]], [[ 9.770115 , 13.304171 , 15.574204 , ..., nan, nan, nan], [11.196156 , 13.686066 , 14.714426 , ..., nan, nan, nan], [11.761392 , 13.2268715 , 13.136265 , ..., nan, nan, nan], ... [ nan, nan, nan, ..., nan, nan, nan], [ nan, nan, nan, ..., nan, nan, nan], [ nan, nan, nan, ..., nan, nan, nan]], [[ nan, nan, nan, ..., nan, nan, nan], [ nan, nan, nan, ..., nan, nan, nan], [ nan, nan, nan, ..., nan, nan, nan], ..., [ nan, nan, nan, ..., nan, nan, nan], [ nan, nan, nan, ..., nan, nan, nan], [ nan, nan, nan, ..., nan, nan, nan]]]], dtype=float32) - WVEL(time, z_w_top, nlat_t, nlon_t)float32-1.145e-06 -1.913e-06 ... nan nan
- long_name :
- Vertical Velocity
- units :
- centimeter/s
- grid_loc :
- 3112
- cell_methods :
- time: mean
array([[[[-1.14457885e-06, -1.91288495e-06, -2.71676004e-06, ..., nan, nan, nan], [-2.08003507e-06, -2.85347369e-06, -3.32594004e-06, ..., nan, nan, nan], [-3.11472149e-06, -3.70206385e-06, -4.09347331e-06, ..., nan, nan, nan], ..., [-3.18068118e-07, -6.31587227e-07, -9.76381443e-07, ..., -8.56450788e-06, -8.88406885e-06, -9.19648483e-06], [ 1.82996402e-07, -1.23177255e-08, -4.03085352e-07, ..., -9.88163902e-06, -1.02769427e-05, -1.05121744e-05], [ 8.15758483e-07, 5.05344588e-07, 2.10113157e-07, ..., -1.10888705e-05, -1.14121858e-05, -1.17109212e-05]], [[-6.78560173e-05, 1.65317997e-05, 8.41080400e-05, ..., nan, nan, nan], [-7.26168801e-05, -2.09417321e-05, 8.21649664e-05, ..., nan, nan, nan], [-2.72717698e-05, 3.63916042e-05, 1.02940867e-04, ..., nan, nan, nan], ... nan, nan, nan], [ nan, nan, nan, ..., nan, nan, nan], [ nan, nan, nan, ..., nan, nan, nan]], [[ nan, nan, nan, ..., nan, nan, nan], [ nan, nan, nan, ..., nan, nan, nan], [ nan, nan, nan, ..., nan, nan, nan], ..., [ nan, nan, nan, ..., nan, nan, nan], [ nan, nan, nan, ..., nan, nan, nan], [ nan, nan, nan, ..., nan, nan, nan]]]], dtype=float32) - TEMP(time, z_t, nlat_t, nlon_t)float3226.87 26.86 26.87 ... nan nan nan
- long_name :
- Potential Temperature
- units :
- degC
- grid_loc :
- 3111
- cell_methods :
- time: mean
array([[[[26.87082 , 26.860653 , 26.87325 , ..., nan, nan, nan], [26.892637 , 26.88897 , 26.904346 , ..., nan, nan, nan], [26.914022 , 26.91649 , 26.931889 , ..., nan, nan, nan], ..., [27.944225 , 27.942217 , 27.93959 , ..., 27.890944 , 27.878847 , 27.86957 ], [27.937271 , 27.932907 , 27.924606 , ..., 27.788717 , 27.77791 , 27.773256 ], [27.93139 , 27.924898 , 27.912024 , ..., 27.733301 , 27.728266 , 27.725992 ]], [[26.843391 , 26.830946 , 26.840658 , ..., nan, nan, nan], [26.86406 , 26.858273 , 26.871187 , ..., nan, nan, nan], [26.88372 , 26.88491 , 26.898113 , ..., nan, nan, nan], ... [ nan, nan, nan, ..., nan, nan, nan], [ nan, nan, nan, ..., nan, nan, nan], [ nan, nan, nan, ..., nan, nan, nan]], [[ nan, nan, nan, ..., nan, nan, nan], [ nan, nan, nan, ..., nan, nan, nan], [ nan, nan, nan, ..., nan, nan, nan], ..., [ nan, nan, nan, ..., nan, nan, nan], [ nan, nan, nan, ..., nan, nan, nan], [ nan, nan, nan, ..., nan, nan, nan]]]], dtype=float32) - DXT(nlat_t, nlon_t)float641.074e+06 1.074e+06 ... 1.074e+06
- long_name :
- x-spacing centered at T points
- units :
- centimeters
- grid_loc :
- 2110
array([[1073515.23592822, 1073515.23592822, 1073515.23592822, ..., 1073515.23592822, 1073515.23592836, 1073515.23592822], [1074001.22366965, 1074001.22366965, 1074001.22366965, ..., 1074001.22366965, 1074001.22366978, 1074001.22366965], [1074484.37491886, 1074484.37491886, 1074484.37491886, ..., 1074484.37491886, 1074484.374919 , 1074484.37491886], ..., [1074964.67403232, 1074964.67403232, 1074964.67403232, ..., 1074964.67403232, 1074964.67403232, 1074964.67403232], [1074484.36592709, 1074484.36592709, 1074484.36592709, ..., 1074484.36592709, 1074484.36592709, 1074484.36592709], [1074001.21457761, 1074001.21457761, 1074001.21457761, ..., 1074001.21457761, 1074001.21457761, 1074001.21457761]]) - DXU(nlat_u, nlon_u)float641.074e+06 1.074e+06 ... 1.074e+06
- long_name :
- x-spacing centered at U points
- units :
- centimeters
- grid_loc :
- 2220
array([[1073758.93807444, 1073758.93807444, 1073758.93807457, ..., 1073758.9380745 , 1073758.9380745 , 1073758.9380745 ], [1074243.50926486, 1074243.50926486, 1074243.50926499, ..., 1074243.50926493, 1074243.50926493, 1074243.50926493], [1074725.24057286, 1074725.24057286, 1074725.240573 , ..., 1074725.24057293, 1074725.24057293, 1074725.24057293], ..., [1074725.23162819, 1074725.23162819, 1074725.23162819, ..., 1074725.23162819, 1074725.23162819, 1074725.23162819], [1074243.50022599, 1074243.50022599, 1074243.50022599, ..., 1074243.50022599, 1074243.50022599, 1074243.50022599], [1073758.92892923, 1073758.92892923, 1073758.92892923, ..., 1073758.92892923, 1073758.92892923, 1073758.92892923]]) - DYT(nlat_t, nlon_t)float641.074e+06 1.074e+06 ... 1.074e+06
- long_name :
- y-spacing centered at T points
- units :
- centimeters
- grid_loc :
- 2110
array([[1073758.93807452, 1073758.93807452, 1073758.93807452, ..., 1073758.93807452, 1073758.93807452, 1073758.93807452], [1074243.50926492, 1074243.50926492, 1074243.50926492, ..., 1074243.50926492, 1074243.50926492, 1074243.50926492], [1074725.24057292, 1074725.24057292, 1074725.24057292, ..., 1074725.24057292, 1074725.24057292, 1074725.24057292], ..., [1075204.12523512, 1075204.12523512, 1075204.12523512, ..., 1075204.12523512, 1075204.12523512, 1075204.12523512], [1074725.24055655, 1074725.24055655, 1074725.24055655, ..., 1074725.24055655, 1074725.24055655, 1074725.24055655], [1074243.50928416, 1074243.50928416, 1074243.50928416, ..., 1074243.50928416, 1074243.50928416, 1074243.50928416]]) - DYU(nlat_u, nlon_u)float641.074e+06 1.074e+06 ... 1.074e+06
- long_name :
- y-spacing centered at U points
- units :
- centimeters
- grid_loc :
- 2220
array([[1074001.22366972, 1074001.22366972, 1074001.22366972, ..., 1074001.22366972, 1074001.22366972, 1074001.22366972], [1074484.37491892, 1074484.37491892, 1074484.37491892, ..., 1074484.37491892, 1074484.37491892, 1074484.37491892], [1074964.68291175, 1074964.68291175, 1074964.68291175, ..., 1074964.68291175, 1074964.68291175, 1074964.68291175], ..., [1074964.68289583, 1074964.68289583, 1074964.68289583, ..., 1074964.68289583, 1074964.68289583, 1074964.68289583], [1074484.37492035, 1074484.37492035, 1074484.37492035, ..., 1074484.37492035, 1074484.37492035, 1074484.37492035], [1074001.22367978, 1074001.22367978, 1074001.22367978, ..., 1074001.22367978, 1074001.22367978, 1074001.22367978]]) - TAREA(nlat_t, nlon_t)float641.153e+12 1.153e+12 ... 1.154e+12
- long_name :
- area of T cells
- units :
- centimeter^2
- grid_loc :
- 2110
array([[1.15269658e+12, 1.15269658e+12, 1.15269658e+12, ..., 1.15269658e+12, 1.15269658e+12, 1.15269658e+12], [1.15373884e+12, 1.15373884e+12, 1.15373884e+12, ..., 1.15373884e+12, 1.15373884e+12, 1.15373884e+12], [1.15477548e+12, 1.15477548e+12, 1.15477548e+12, ..., 1.15477548e+12, 1.15477548e+12, 1.15477548e+12], ..., [1.15580645e+12, 1.15580645e+12, 1.15580645e+12, ..., 1.15580645e+12, 1.15580645e+12, 1.15580645e+12], [1.15477547e+12, 1.15477547e+12, 1.15477547e+12, ..., 1.15477547e+12, 1.15477547e+12, 1.15477547e+12], [1.15373883e+12, 1.15373883e+12, 1.15373883e+12, ..., 1.15373883e+12, 1.15373883e+12, 1.15373883e+12]]) - UAREA(nlat_u, nlon_u)float641.153e+12 1.153e+12 ... 1.153e+12
- long_name :
- area of U cells
- units :
- centimeter^2
- grid_loc :
- 2220
array([[1.15321841e+12, 1.15321841e+12, 1.15321841e+12, ..., 1.15321841e+12, 1.15321841e+12, 1.15321841e+12], [1.15425787e+12, 1.15425787e+12, 1.15425787e+12, ..., 1.15425787e+12, 1.15425787e+12, 1.15425787e+12], [1.15529168e+12, 1.15529168e+12, 1.15529168e+12, ..., 1.15529168e+12, 1.15529168e+12, 1.15529168e+12], ..., [1.15529167e+12, 1.15529167e+12, 1.15529167e+12, ..., 1.15529167e+12, 1.15529167e+12, 1.15529167e+12], [1.15425786e+12, 1.15425786e+12, 1.15425786e+12, ..., 1.15425786e+12, 1.15425786e+12, 1.15425786e+12], [1.15321840e+12, 1.15321840e+12, 1.15321840e+12, ..., 1.15321840e+12, 1.15321840e+12, 1.15321840e+12]]) - QSW_3D(time, z_w_top, nlat_t, nlon_t)float32245.0 245.2 245.5 ... nan nan nan
- long_name :
- Solar Short-Wave Heat Flux
- units :
- watt/m^2
- grid_loc :
- 3112
- cell_methods :
- time: mean
array([[[[2.4503796e+02, 2.4521341e+02, 2.4545235e+02, ..., nan, nan, nan], [2.4492380e+02, 2.4512425e+02, 2.4535846e+02, ..., nan, nan, nan], [2.4538518e+02, 2.4562317e+02, 2.4585333e+02, ..., nan, nan, nan], ..., [2.1068733e+02, 2.1091066e+02, 2.1109772e+02, ..., 2.0814592e+02, 2.0798094e+02, 2.0769438e+02], [2.0984216e+02, 2.0997974e+02, 2.1009404e+02, ..., 2.0629115e+02, 2.0618259e+02, 2.0596118e+02], [2.0890120e+02, 2.0894778e+02, 2.0897307e+02, ..., 2.0409979e+02, 2.0402664e+02, 2.0386365e+02]], [[7.4346901e+01, 7.4893471e+01, 7.4966232e+01, ..., nan, nan, nan], [7.4140999e+01, 7.5024002e+01, 7.4937622e+01, ..., nan, nan, nan], [7.3926872e+01, 7.5331734e+01, 7.5553886e+01, ..., nan, nan, nan], ... [ nan, nan, nan, ..., nan, nan, nan], [ nan, nan, nan, ..., nan, nan, nan], [ nan, nan, nan, ..., nan, nan, nan]], [[ nan, nan, nan, ..., nan, nan, nan], [ nan, nan, nan, ..., nan, nan, nan], [ nan, nan, nan, ..., nan, nan, nan], ..., [ nan, nan, nan, ..., nan, nan, nan], [ nan, nan, nan, ..., nan, nan, nan], [ nan, nan, nan, ..., nan, nan, nan]]]], dtype=float32) - HDIFE_TEMP(time, z_t, nlat_t, nlon_u)float32-2.614e-09 3.977e-10 ... 0.0 0.0
- long_name :
- TEMP Horizontal Diffusive Flux in grid-x direction
- units :
- degC/s
- grid_loc :
- 3211
- cell_methods :
- time: mean
array([[[[-2.61363331e-09, 3.97678473e-10, 5.53805890e-09, ..., 0.00000000e+00, 0.00000000e+00, 0.00000000e+00], [-2.02023864e-09, 4.69246086e-10, 3.53268170e-09, ..., 0.00000000e+00, 0.00000000e+00, 0.00000000e+00], [-6.58720467e-10, 3.35899447e-10, 4.35073089e-09, ..., 0.00000000e+00, 0.00000000e+00, 0.00000000e+00], ..., [ 7.77489517e-10, 5.60605951e-10, 1.05229159e-09, ..., -3.79286513e-09, -2.29235653e-09, -1.63621450e-09], [-1.17345147e-10, -7.85200405e-10, -2.93594093e-10, ..., -1.56652413e-09, 9.83300774e-10, 1.27887168e-09], [-1.61476321e-09, -1.67141367e-09, -1.29242805e-09, ..., -7.67886657e-11, 3.05740378e-13, -1.06822218e-09]], [[-2.69555733e-09, -1.73000336e-10, 5.53882273e-09, ..., 0.00000000e+00, 0.00000000e+00, 0.00000000e+00], [-2.20887775e-09, 2.73736506e-10, 3.42142537e-09, ..., 0.00000000e+00, 0.00000000e+00, 0.00000000e+00], [-1.14210606e-10, -2.05884476e-10, 4.37129932e-09, ..., 0.00000000e+00, 0.00000000e+00, 0.00000000e+00], ... 0.00000000e+00, 0.00000000e+00, 0.00000000e+00], [ 0.00000000e+00, 0.00000000e+00, 0.00000000e+00, ..., 0.00000000e+00, 0.00000000e+00, 0.00000000e+00], [ 0.00000000e+00, 0.00000000e+00, 0.00000000e+00, ..., 0.00000000e+00, 0.00000000e+00, 0.00000000e+00]], [[ 0.00000000e+00, 0.00000000e+00, 0.00000000e+00, ..., 0.00000000e+00, 0.00000000e+00, 0.00000000e+00], [ 0.00000000e+00, 0.00000000e+00, 0.00000000e+00, ..., 0.00000000e+00, 0.00000000e+00, 0.00000000e+00], [ 0.00000000e+00, 0.00000000e+00, 0.00000000e+00, ..., 0.00000000e+00, 0.00000000e+00, 0.00000000e+00], ..., [ 0.00000000e+00, 0.00000000e+00, 0.00000000e+00, ..., 0.00000000e+00, 0.00000000e+00, 0.00000000e+00], [ 0.00000000e+00, 0.00000000e+00, 0.00000000e+00, ..., 0.00000000e+00, 0.00000000e+00, 0.00000000e+00], [ 0.00000000e+00, 0.00000000e+00, 0.00000000e+00, ..., 0.00000000e+00, 0.00000000e+00, 0.00000000e+00]]]], dtype=float32) - HDIFN_TEMP(time, z_t, nlat_u, nlon_t)float321.523e-09 2.115e-09 ... 0.0 0.0
- long_name :
- TEMP Horizontal Diffusive Flux in grid-y direction
- units :
- degC/s
- grid_loc :
- 3121
- cell_methods :
- time: mean
array([[[[ 1.5234107e-09, 2.1147035e-09, 2.1866646e-09, ..., 0.0000000e+00, 0.0000000e+00, 0.0000000e+00], [ 1.0528922e-09, 2.4132025e-09, 2.2802233e-09, ..., 0.0000000e+00, 0.0000000e+00, 0.0000000e+00], [ 1.0610099e-09, 8.2111201e-10, 3.3776854e-10, ..., 0.0000000e+00, 0.0000000e+00, 0.0000000e+00], ..., [ 6.5940325e-10, -2.3492633e-10, -1.5794358e-09, ..., -2.2142579e-08, -1.9915809e-08, -1.6642490e-08], [ 9.3933317e-10, -5.5595600e-10, -1.4402700e-09, ..., -1.8002760e-09, -3.1114103e-10, -1.2936970e-09], [ 3.5679815e-10, 1.4825304e-09, 1.1625649e-09, ..., 1.9614790e-08, 2.2439606e-08, 2.3393657e-08]], [[ 1.4882273e-09, 1.9726851e-09, 2.4194657e-09, ..., 0.0000000e+00, 0.0000000e+00, 0.0000000e+00], [ 4.5186824e-10, 2.5454869e-09, 2.0658932e-09, ..., 0.0000000e+00, 0.0000000e+00, 0.0000000e+00], [ 1.0766217e-09, 4.0454967e-10, 2.9939556e-10, ..., 0.0000000e+00, 0.0000000e+00, 0.0000000e+00], ... 0.0000000e+00, 0.0000000e+00, 0.0000000e+00], [ 0.0000000e+00, 0.0000000e+00, 0.0000000e+00, ..., 0.0000000e+00, 0.0000000e+00, 0.0000000e+00], [ 0.0000000e+00, 0.0000000e+00, 0.0000000e+00, ..., 0.0000000e+00, 0.0000000e+00, 0.0000000e+00]], [[ 0.0000000e+00, 0.0000000e+00, 0.0000000e+00, ..., 0.0000000e+00, 0.0000000e+00, 0.0000000e+00], [ 0.0000000e+00, 0.0000000e+00, 0.0000000e+00, ..., 0.0000000e+00, 0.0000000e+00, 0.0000000e+00], [ 0.0000000e+00, 0.0000000e+00, 0.0000000e+00, ..., 0.0000000e+00, 0.0000000e+00, 0.0000000e+00], ..., [ 0.0000000e+00, 0.0000000e+00, 0.0000000e+00, ..., 0.0000000e+00, 0.0000000e+00, 0.0000000e+00], [ 0.0000000e+00, 0.0000000e+00, 0.0000000e+00, ..., 0.0000000e+00, 0.0000000e+00, 0.0000000e+00], [ 0.0000000e+00, 0.0000000e+00, 0.0000000e+00, ..., 0.0000000e+00, 0.0000000e+00, 0.0000000e+00]]]], dtype=float32) - dz(z_t)float32...
- long_name :
- thickness of layer k
- units :
- centimeters
[62 values with dtype=float32]
- dzw(z_w_top)float32...
- long_name :
- midpoint of k to midpoint of k+1
- units :
- centimeters
[62 values with dtype=float32]
- hflux_factor()float64...
- long_name :
- Convert Heat and Solar Flux to Temperature Flux
[1 values with dtype=float64]
- KMT(nlat_t, nlon_t)float6454.0 54.0 51.0 ... 55.0 55.0 55.0
- long_name :
- k Index of Deepest Grid Cell on T Grid
- grid_loc :
- 2110
array([[54., 54., 51., ..., 0., 0., 0.], [54., 54., 51., ..., 0., 0., 0.], [53., 53., 53., ..., 0., 0., 0.], ..., [60., 59., 58., ..., 55., 55., 55.], [60., 60., 58., ..., 55., 55., 55.], [60., 60., 57., ..., 55., 55., 55.]]) - KMU(nlat_u, nlon_u)float6454.0 51.0 50.0 ... 55.0 55.0 54.0
- long_name :
- k Index of Deepest Grid Cell on U Grid
- grid_loc :
- 2220
array([[54., 51., 50., ..., 0., 0., 0.], [53., 51., 50., ..., 0., 0., 0.], [51., 53., 50., ..., 0., 0., 0.], ..., [59., 58., 53., ..., 55., 55., 55.], [60., 57., 51., ..., 55., 55., 55.], [60., 57., 51., ..., 55., 55., 54.]]) - DIA_IMPVF_TEMP(time, z_w_bot, nlat_t, nlon_t)float320.002014 0.002064 ... nan nan
- long_name :
- TEMP Flux Across Bottom Face from Diabatic Implicit Vertical Mixing
- units :
- degC cm/s
- grid_loc :
- 3113
- cell_methods :
- time: mean
array([[[[ 0.00201446, 0.00206392, 0.00216143, ..., nan, nan, nan], [ 0.00207787, 0.00209014, 0.0020967 , ..., nan, nan, nan], [ 0.00211517, 0.00207939, 0.00206672, ..., nan, nan, nan], ..., [-0.00047228, -0.000478 , -0.00047246, ..., 0.00089965, 0.00086071, 0.00085359], [-0.00048336, -0.00052305, -0.00054949, ..., 0.00081171, 0.00079006, 0.00077401], [-0.00050689, -0.00061991, -0.00065286, ..., 0.00081445, 0.00080362, 0.00079664]], [[ 0.00156129, 0.00148329, 0.00143757, ..., nan, nan, nan], [ 0.00149684, 0.00133019, 0.00116567, ..., nan, nan, nan], [ 0.00137402, 0.00115166, 0.00100973, ..., nan, nan, nan], ... [ nan, nan, nan, ..., nan, nan, nan], [ nan, nan, nan, ..., nan, nan, nan], [ nan, nan, nan, ..., nan, nan, nan]], [[ nan, nan, nan, ..., nan, nan, nan], [ nan, nan, nan, ..., nan, nan, nan], [ nan, nan, nan, ..., nan, nan, nan], ..., [ nan, nan, nan, ..., nan, nan, nan], [ nan, nan, nan, ..., nan, nan, nan], [ nan, nan, nan, ..., nan, nan, nan]]]], dtype=float32) - SHF(time, nlat_t, nlon_t)float3294.64 96.18 96.52 ... -58.45 -58.65
- long_name :
- Total Surface Heat Flux, Including SW
- units :
- watt/m^2
- grid_loc :
- 2110
- cell_methods :
- time: mean
array([[[ 94.63771 , 96.180855, 96.5201 , ..., nan, nan, nan], [ 94.54357 , 95.62748 , 95.657 , ..., nan, nan, nan], [ 94.91275 , 95.54686 , 95.41937 , ..., nan, nan, nan], ..., [-110.82676 , -110.83065 , -110.76642 , ..., -61.922012, -61.4474 , -61.26228 ], [-112.51893 , -112.39957 , -111.94688 , ..., -58.07367 , -57.64793 , -57.7017 ], [-114.27047 , -114.06644 , -113.31602 , ..., -58.45006 , -58.448246, -58.651115]]], dtype=float32) - SHF_QSW(time, nlat_t, nlon_t)float32245.0 245.2 245.5 ... 204.0 203.9
- long_name :
- Solar Short-Wave Heat Flux
- units :
- watt/m^2
- grid_loc :
- 2110
- cell_methods :
- time: mean
array([[[245.03796, 245.21341, 245.45235, ..., nan, nan, nan], [244.9238 , 245.12425, 245.35846, ..., nan, nan, nan], [245.38518, 245.62317, 245.85333, ..., nan, nan, nan], ..., [210.68733, 210.91066, 211.09772, ..., 208.14592, 207.98094, 207.69438], [209.84216, 209.97974, 210.09404, ..., 206.29115, 206.18259, 205.96118], [208.9012 , 208.94778, 208.97307, ..., 204.0998 , 204.02664, 203.86365]]], dtype=float32) - DZU(z_t, nlat_u, nlon_u)float321e+03 1e+03 ... 2.5e+04 2.5e+04
- longname :
- U-grid cell thickness
- units :
- cm
- grid_loc :
- 3221
array([[[ 1000. , 1000. , 1000. , ..., 1000. , 1000. , 1000. ], [ 1000. , 1000. , 1000. , ..., 1000. , 1000. , 1000. ], [ 1000. , 1000. , 1000. , ..., 1000. , 1000. , 1000. ], ..., [ 1000. , 1000. , 1000. , ..., 1000. , 1000. , 1000. ], [ 1000. , 1000. , 1000. , ..., 1000. , 1000. , 1000. ], [ 1000. , 1000. , 1000. , ..., 1000. , 1000. , 1000. ]], [[ 1000. , 1000. , 1000. , ..., 1000. , 1000. , 1000. ], [ 1000. , 1000. , 1000. , ..., 1000. , 1000. , 1000. ], [ 1000. , 1000. , 1000. , ..., 1000. , 1000. , 1000. ], ... [25000. , 25000. , 25000. , ..., 25000. , 25000. , 25000. ], [25000. , 25000. , 25000. , ..., 25000. , 25000. , 25000. ], [25000. , 25000. , 25000. , ..., 25000. , 25000. , 25000. ]], [[25000. , 25000. , 25000. , ..., 25000. , 25000. , 25000. ], [25000. , 25000. , 25000. , ..., 25000. , 25000. , 25000. ], [25000. , 25000. , 25000. , ..., 25000. , 25000. , 25000. ], ..., [25000. , 25000. , 25000. , ..., 25000. , 25000. , 25000. ], [25000. , 25000. , 25000. , ..., 25000. , 25000. , 25000. ], [25000. , 25000. , 25000. , ..., 25000. , 25000. , 25000. ]]], dtype=float32) - DZT(z_t, nlat_t, nlon_t)float321e+03 1e+03 ... 2.5e+04 2.5e+04
- longname :
- T-grid cell thickness
- units :
- cm
- grid_loc :
- 3111
array([[[ 1000. , 1000. , 1000. , ..., 1000. , 1000. , 1000. ], [ 1000. , 1000. , 1000. , ..., 1000. , 1000. , 1000. ], [ 1000. , 1000. , 1000. , ..., 1000. , 1000. , 1000. ], ..., [ 1000. , 1000. , 1000. , ..., 1000. , 1000. , 1000. ], [ 1000. , 1000. , 1000. , ..., 1000. , 1000. , 1000. ], [ 1000. , 1000. , 1000. , ..., 1000. , 1000. , 1000. ]], [[ 1000. , 1000. , 1000. , ..., 1000. , 1000. , 1000. ], [ 1000. , 1000. , 1000. , ..., 1000. , 1000. , 1000. ], [ 1000. , 1000. , 1000. , ..., 1000. , 1000. , 1000. ], ... [25000. , 25000. , 25000. , ..., 25000. , 25000. , 25000. ], [25000. , 25000. , 25000. , ..., 25000. , 25000. , 25000. ], [25000. , 25000. , 25000. , ..., 25000. , 25000. , 25000. ]], [[25000. , 25000. , 25000. , ..., 25000. , 25000. , 25000. ], [25000. , 25000. , 25000. , ..., 25000. , 25000. , 25000. ], [25000. , 25000. , 25000. , ..., 25000. , 25000. , 25000. ], ..., [25000. , 25000. , 25000. , ..., 25000. , 25000. , 25000. ], [25000. , 25000. , 25000. , ..., 25000. , 25000. , 25000. ], [25000. , 25000. , 25000. , ..., 25000. , 25000. , 25000. ]]], dtype=float32) - SALT(time, z_t, nlat_t, nlon_t)float3235.0 35.0 35.0 ... 35.0 35.0 35.0
- grid_loc :
- 3111
array([[[[35., 35., 35., ..., 35., 35., 35.], [35., 35., 35., ..., 35., 35., 35.], [35., 35., 35., ..., 35., 35., 35.], ..., [35., 35., 35., ..., 35., 35., 35.], [35., 35., 35., ..., 35., 35., 35.], [35., 35., 35., ..., 35., 35., 35.]], [[35., 35., 35., ..., 35., 35., 35.], [35., 35., 35., ..., 35., 35., 35.], [35., 35., 35., ..., 35., 35., 35.], ..., [35., 35., 35., ..., 35., 35., 35.], [35., 35., 35., ..., 35., 35., 35.], [35., 35., 35., ..., 35., 35., 35.]], [[35., 35., 35., ..., 35., 35., 35.], [35., 35., 35., ..., 35., 35., 35.], [35., 35., 35., ..., 35., 35., 35.], ..., ... ..., [35., 35., 35., ..., 35., 35., 35.], [35., 35., 35., ..., 35., 35., 35.], [35., 35., 35., ..., 35., 35., 35.]], [[35., 35., 35., ..., 35., 35., 35.], [35., 35., 35., ..., 35., 35., 35.], [35., 35., 35., ..., 35., 35., 35.], ..., [35., 35., 35., ..., 35., 35., 35.], [35., 35., 35., ..., 35., 35., 35.], [35., 35., 35., ..., 35., 35., 35.]], [[35., 35., 35., ..., 35., 35., 35.], [35., 35., 35., ..., 35., 35., 35.], [35., 35., 35., ..., 35., 35., 35.], ..., [35., 35., 35., ..., 35., 35., 35.], [35., 35., 35., ..., 35., 35., 35.], [35., 35., 35., ..., 35., 35., 35.]]]], dtype=float32) - rho(time, z_t, nlat_t, nlon_t)float641.023e+03 1.023e+03 ... nan nan
- units :
- kg/m^3
- long_name :
- Density
array([[[[1022.77965132, 1022.78288965, 1022.77887716, ...,
                    nan,           nan,           nan],
         [1022.77269872, 1022.77386777, 1022.76896598, ...,
                    nan,           nan,           nan],
         [1022.76588063, 1022.76509352, 1022.76018185, ...,
                    nan,           nan,           nan],
         ...,
         [1022.43337622, 1022.43403214, 1022.43488984, ...,
          1022.45076698, 1022.45471222, 1022.4577373 ],
         [1022.43564721, 1022.43707216, 1022.43978215, ...,
          1022.48407392, 1022.48759049, 1022.4891046 ],
         [1022.43756724, 1022.43968689, 1022.44388914, ...,
          1022.50209696, 1022.5037335 , 1022.50447236]],

        [[1022.83046493, 1022.83442815, 1022.83133542, ...,
                    nan,           nan,           nan],
         [1022.82388068, 1022.82572455, 1022.82160923, ...,
                    nan,           nan,           nan],
         [1022.81761427, 1022.81723484, 1022.81302509, ...,
                    nan,           nan,           nan],
...
         [          nan,           nan,           nan, ...,
                    nan,           nan,           nan],
         [          nan,           nan,           nan, ...,
                    nan,           nan,           nan],
         [          nan,           nan,           nan, ...,
                    nan,           nan,           nan]],

        [[          nan,           nan,           nan, ...,
                    nan,           nan,           nan],
         [          nan,           nan,           nan, ...,
                    nan,           nan,           nan],
         [          nan,           nan,           nan, ...,
                    nan,           nan,           nan],
         ...,
         [          nan,           nan,           nan, ...,
                    nan,           nan,           nan],
         [          nan,           nan,           nan, ...,
                    nan,           nan,           nan],
         [          nan,           nan,           nan, ...,
                    nan,           nan,           nan]]]])
- timePandasIndex
PandasIndex(CFTimeIndex([0036-12-07 00:00:00], dtype='object', length=1, calendar='noleap', freq=None)) - z_tPandasIndex
PandasIndex(Index([ 500.0, 1500.0, 2500.0, 3500.0, 4500.0, 5500.0, 6500.0, 7500.0, 8500.0, 9500.0, 10500.0, 11500.0, 12500.0, 13500.0, 14500.0, 15500.0, 16509.83984375, 17547.904296875, 18629.126953125, 19766.02734375, 20971.138671875, 22257.828125, 23640.8828125, 25137.015625, 26765.419921875, 28548.365234375, 30511.921875, 32686.798828125, 35109.34765625, 37822.76171875, 40878.46484375, 44337.76953125, 48273.671875, 52772.80078125, 57937.2890625, 63886.26171875, 70756.328125, 78700.25, 87882.5234375, 98470.5859375, 110620.421875, 124456.6875, 140049.71875, 157394.640625, 176400.328125, 196894.421875, 218645.65625, 241397.15625, 264900.125, 288938.46875, 313340.46875, 337979.34375, 362767.03125, 387645.1875, 412576.8125, 437539.25, 462519.03125, 487508.34375, 512502.8125, 537500.0, 562499.0625, 587499.0625], dtype='float32', name='z_t')) - z_w_topPandasIndex
PandasIndex(Index([ 0.0, 1000.0, 2000.0, 3000.0, 4000.0, 5000.0, 6000.0, 7000.0, 8000.0, 9000.0, 10000.0, 11000.0, 12000.0, 13000.0, 14000.0, 15000.0, 16000.0, 17019.681640625, 18076.12890625, 19182.125, 20349.931640625, 21592.34375, 22923.3125, 24358.453125, 25915.580078125, 27615.259765625, 29481.470703125, 31542.373046875, 33831.2265625, 36387.47265625, 39258.046875, 42498.88671875, 46176.65625, 50370.6875, 55174.91015625, 60699.66796875, 67072.859375, 74439.8046875, 82960.6953125, 92804.3515625, 104136.8203125, 117104.015625, 131809.359375, 148290.078125, 166499.203125, 186301.4375, 207487.390625, 229803.90625, 252990.40625, 276809.84375, 301067.0625, 325613.84375, 350344.875, 375189.1875, 400101.15625, 425052.46875, 450026.0625, 475012.0, 500004.6875, 525000.9375, 549999.0625, 574999.0625], dtype='float32', name='z_w_top')) - z_w_botPandasIndex
PandasIndex(Index([ 1000.0, 2000.0, 3000.0, 4000.0, 5000.0, 6000.0, 7000.0, 8000.0, 9000.0, 10000.0, 11000.0, 12000.0, 13000.0, 14000.0, 15000.0, 16000.0, 17019.681640625, 18076.12890625, 19182.125, 20349.931640625, 21592.34375, 22923.3125, 24358.453125, 25915.580078125, 27615.259765625, 29481.470703125, 31542.373046875, 33831.2265625, 36387.47265625, 39258.046875, 42498.88671875, 46176.65625, 50370.6875, 55174.91015625, 60699.66796875, 67072.859375, 74439.8046875, 82960.6953125, 92804.3515625, 104136.8203125, 117104.015625, 131809.359375, 148290.078125, 166499.203125, 186301.4375, 207487.390625, 229803.90625, 252990.40625, 276809.84375, 301067.0625, 325613.84375, 350344.875, 375189.1875, 400101.15625, 425052.46875, 450026.0625, 475012.0, 500004.6875, 525000.9375, 549999.0625, 574999.0625, 599999.0625], dtype='float32', name='z_w_bot')) - nlon_uPandasIndex
PandasIndex(Index([ 1, 2, 3, 4, 5, 6, 7, 8, 9, 10, ... 1292, 1293, 1294, 1295, 1296, 1297, 1298, 1299, 1300, 1301], dtype='int64', name='nlon_u', length=1301)) - nlat_uPandasIndex
PandasIndex(Index([ 1, 2, 3, 4, 5, 6, 7, 8, 9, 10, ... 296, 297, 298, 299, 300, 301, 302, 303, 304, 305], dtype='int64', name='nlat_u', length=305)) - nlon_tPandasIndex
PandasIndex(Index([ 0.5, 1.5, 2.5, 3.5, 4.5, 5.5, 6.5, 7.5, 8.5, 9.5, ... 1291.5, 1292.5, 1293.5, 1294.5, 1295.5, 1296.5, 1297.5, 1298.5, 1299.5, 1300.5], dtype='float64', name='nlon_t', length=1301)) - nlat_tPandasIndex
PandasIndex(Index([  0.5,   1.5,   2.5,   3.5,   4.5,   5.5,   6.5,   7.5,   8.5,   9.5,
       ...
       295.5, 296.5, 297.5, 298.5, 299.5, 300.5, 301.5, 302.5, 303.5, 304.5],
      dtype='float64', name='nlat_t', length=305))
- title :
- g.e20.G.TL319_t13.control.001_hfreq
- history :
- none
- Conventions :
- CF-1.0; http://www.cgd.ucar.edu/cms/eaton/netcdf/CF-current.htm
- time_period_freq :
- day_5
- model_doi_url :
- https://doi.org/10.5065/D67H1H0V
- contents :
- Diagnostic and Prognostic Variables
- source :
- CCSM POP2, the CCSM Ocean Component
- revision :
- $Id: tavg.F90 89091 2018-04-30 15:58:32Z altuntas@ucar.edu $
- calendar :
- All years have exactly 365 days.
- start_time :
- This dataset was created on 2018-12-14 at 16:05:58.8
- cell_methods :
- cell_methods = time: mean ==> the variable values are averaged over the time interval between the previous time coordinate and the current one. cell_methods absent ==> the variable values are at the time given by the current time coordinate.
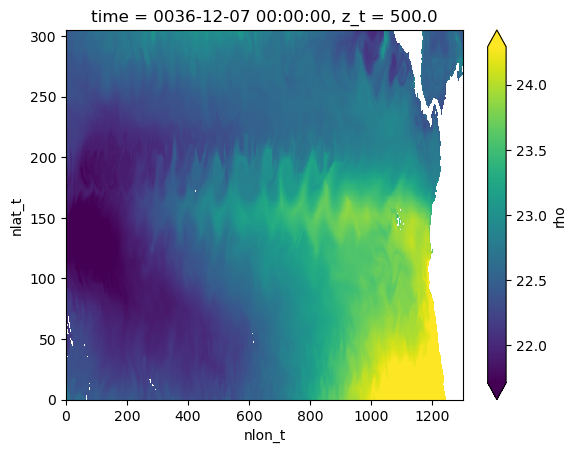
Visualize surface density field#
(xds.rho - 1000).isel(z_t=0).plot(robust=True)
<matplotlib.collections.QuadMesh at 0x7f5e6d456ee0>
Regrid to density space using grid.transform#
See https://xgcm.readthedocs.io/en/latest/transform.html for more
regridded = grid.transform(
    xds.TEMP,
    axis="Z",
    target=np.arange(25, 30, 0.5),
    target_data=xds.rho - 1000,
    method="linear",
)
/home/docs/checkouts/readthedocs.org/user_builds/pop-tools/conda/latest/lib/python3.9/site-packages/xgcm/grid.py:989: FutureWarning: From version 0.8.0 the Axis computation methods will be removed, in favour of using the Grid computation methods instead. i.e. use `Grid.transform` instead of `Axis.transform`
  warnings.warn(
/home/docs/checkouts/readthedocs.org/user_builds/pop-tools/conda/latest/lib/python3.9/site-packages/numba/np/ufunc/gufunc.py:252: RuntimeWarning: invalid value encountered in _interp_1d_linear
  return self.ufunc(*args, **kwargs)
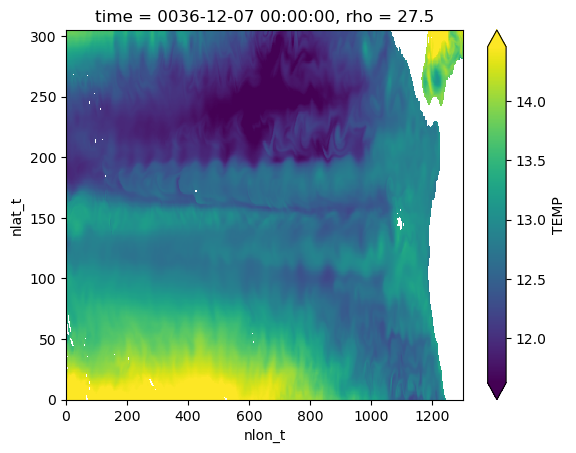
Visualize temperature on a single isopycnal surface#
regridded.isel(rho=5).plot(robust=True)
<matplotlib.collections.QuadMesh at 0x7f5e713573d0>
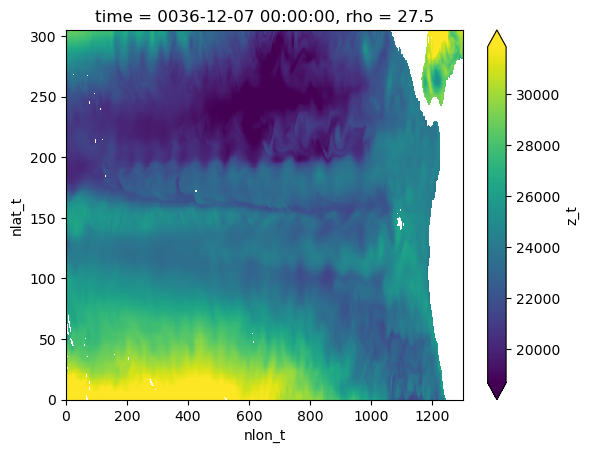
Find depth of isopycnal surface#
regridded.coords["z_t"] = grid.transform(
    xds.z_t.broadcast_like(xds.rho),
    axis="Z",
    target=np.arange(24, 30, 0.5),
    target_data=xds.rho - 1000,
    method="linear",
)
regridded.z_t.isel(rho=5).plot(robust=True)
<matplotlib.collections.QuadMesh at 0x7f5e6cd085e0>