
Lateral fill concept#
When regidding datasets for initial conditions, it is necessary to ensure that all model points have data. In many cases, differences between land-sea masks yield regions along the margins that require filling. The lateral_fill_np_array() routine applies an iterative filling procedure to accomplish this. This is illustrated here.
Import packages#
%matplotlib inline

import matplotlib.pyplot as plt
import numpy as np
import xarray as xr

import pop_tools
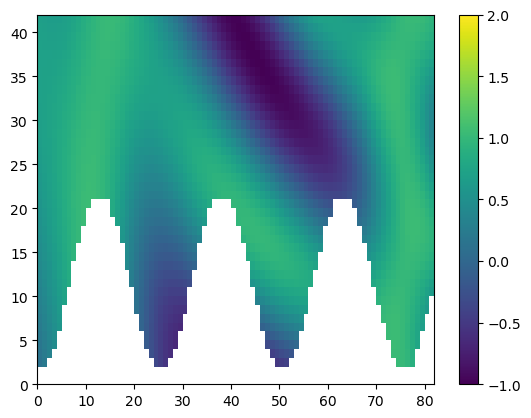
Generate some psuedo-data with coastline#
dx, dy = 0.05, 0.05

y, x = np.mgrid[slice(1 - dy, 3 + dy, dy), slice(1 - dx, 5 + dx, dx)]

z_orig = np.sin(x) ** 10 + np.cos(10 + y * x) * np.cos(x)

valid_points = np.ones(z_orig.shape, dtype=bool)
valid_points = np.where(y < 0.5 * np.sin(5 * x) + 1.5, False, valid_points)

z_orig = np.where(~valid_points, np.nan, z_orig)
z_orig[0, :] = np.nan


cb = plt.pcolormesh(z_orig, vmin=-1, vmax=2.0)
h = plt.colorbar(cb)
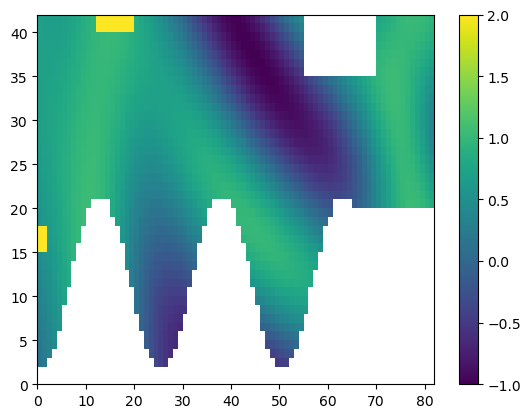
Add missing values in one embayment and a random block in the top of the domain. Put some “blobs” of elevated values to show periodicity.
z_miss = z_orig.copy()

z_miss[:20, 62:] = np.nan
z_miss[35:, 55:70] = np.nan

z_miss[15:18, 0:2] = 10.0

z_miss[-2:, 12:20] = 10.0

cb = plt.pcolormesh(z_miss, vmin=-1, vmax=2.0)
h = plt.colorbar(cb)
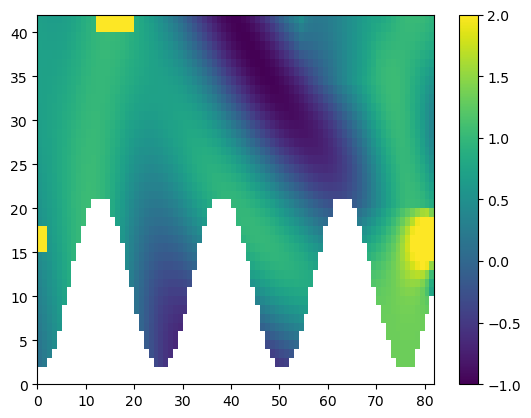
Perform lateral fill#
%%time

z_fill = pop_tools.lateral_fill_np_array(z_miss, valid_points, ltripole=False)

plt.figure()
cb = plt.pcolormesh(z_fill, vmin=-1, vmax=2.0)
h = plt.colorbar(cb)
CPU times: user 759 ms, sys: 12.2 ms, total: 771 ms
Wall time: 748 ms
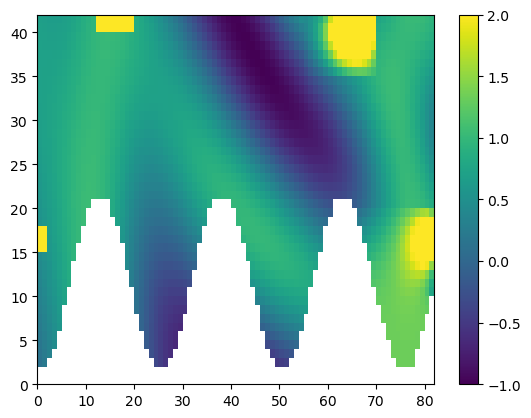
Setting ltripole = True makes the domain periodic across the top boundary.
%%time
z_fill = pop_tools.lateral_fill_np_array(z_miss, valid_points, ltripole=True)

plt.figure()
cb = plt.pcolormesh(z_fill, vmin=-1, vmax=2.0)
h = plt.colorbar(cb)
CPU times: user 66 ms, sys: 1.91 ms, total: 67.9 ms
Wall time: 38.6 ms
%load_ext watermark
%watermark -d -iv -m -g -h
Compiler    : GCC 13.3.0
OS          : Linux
Release     : 6.17.0-1007-aws
Machine     : x86_64
Processor   : x86_64
CPU cores   : 2
Architecture: 64bit

Hostname: build-32095474-project-451810-pop-tools

Git hash: d3177f392237bc6adcac68c1963bdc5fe1a3ccd6

pop_tools : 0.0.post50+dirty
xarray    : 2024.7.0
numpy     : 2.0.2
matplotlib: 3.9.4