
Using xgcm with POP output#
In this notebook we will use xgcm capability to calculate divergence, vorticity and scalar gradients from high resolution (0.1\(^{\circ}\)) POP output. We will
demonstrate the functions needed for these operations with basic
xarraytranslate them to the corresponding
xgcmversion usingdiff()andinterp().use
xgcm.get_metriccapabilities to simplify the code.
The metrics functionality lets us write generalized div, grad and curl functions that should be available in xgcm in the future (see xgcm/xgcm #187).
This notebook was contributed by Anna-Lena Deppenmeier.
Import packages#
import numpy as np
import xarray as xr
import xgcm
from matplotlib import pyplot as plt

import pop_tools

%matplotlib inline
plt.rcParams["figure.figsize"] = (10, 6)
Open example dataset and modify it to work with xgcm#
For the relabeling the dataset must contain DZU and DZT (they are also needed in calculations later on)
# open sample data
filepath = pop_tools.DATASETS.fetch('Pac_POP0.1_JRA_IAF_1993-12-6-test.nc')
ds = xr.open_dataset(filepath)

# get DZU and DZT, needed for operations later on
filepath_g = pop_tools.DATASETS.fetch('Pac_grid_pbc_1301x305x62.tx01_62l.2013-07-13.nc')
ds_g = xr.open_dataset(filepath_g)
ds["DZT"] = ds_g.DZT
ds["DZU"] = ds_g.DZU
ds["cell_volume_t"] = ds_g.DZT * ds_g.DXT * ds_g.DYT
ds["cell_volume_u"] = ds_g.DZU * ds_g.DXT * ds_g.DYT
ds contains the usual dimensions nlat, nlon, etc:
ds
<xarray.Dataset>
Dimensions:         (nlat: 305, nlon: 1301, time: 1, z_t: 62, z_w: 62, z_w_bot: 62, z_w_top: 62)
Coordinates:
  * time            (time) object 0036-12-07 00:00:00
  * z_t             (z_t) float32 500.0 1.5e+03 2.5e+03 ... 5.625e+05 5.875e+05
  * z_w             (z_w) float32 0.0 1e+03 2e+03 ... 5.25e+05 5.5e+05 5.75e+05
  * z_w_top         (z_w_top) float32 0.0 1e+03 2e+03 ... 5.5e+05 5.75e+05
  * z_w_bot         (z_w_bot) float32 1e+03 2e+03 3e+03 ... 5.75e+05 6e+05
    ULONG           (nlat, nlon) float64 ...
    ULAT            (nlat, nlon) float64 ...
    TLONG           (nlat, nlon) float64 ...
    TLAT            (nlat, nlon) float64 ...
Dimensions without coordinates: nlat, nlon
Data variables: (12/30)
    TEND_TEMP       (time, z_t, nlat, nlon) float32 ...
    UET             (time, z_t, nlat, nlon) float32 ...
    VNT             (time, z_t, nlat, nlon) float32 ...
    WTT             (time, z_w_top, nlat, nlon) float32 ...
    KPP_SRC_TEMP    (time, z_t, nlat, nlon) float32 ...
    UVEL            (time, z_t, nlat, nlon) float32 ...
    ...              ...
    SHF             (time, nlat, nlon) float32 ...
    SHF_QSW         (time, nlat, nlon) float32 ...
    DZT             (z_t, nlat, nlon) float32 ...
    DZU             (z_t, nlat, nlon) float32 ...
    cell_volume_t   (z_t, nlat, nlon) float64 1.153e+15 1.153e+15 ... 2.884e+16
    cell_volume_u   (z_t, nlat, nlon) float64 1.153e+15 1.153e+15 ... 2.884e+16
Attributes:
    title:             g.e20.G.TL319_t13.control.001_hfreq
    history:           none
    Conventions:       CF-1.0; http://www.cgd.ucar.edu/cms/eaton/netcdf/CF-cu...
    time_period_freq:  day_5
    model_doi_url:     https://doi.org/10.5065/D67H1H0V
    contents:          Diagnostic and Prognostic Variables
    source:            CCSM POP2, the CCSM Ocean Component
    revision:          $Id: tavg.F90 89091 2018-04-30 15:58:32Z altuntas@ucar...
    calendar:          All years have exactly  365 days.
    start_time:        This dataset was created on 2018-12-14 at 16:05:58.8
cell_methods: cell_methods = time: mean ==> the variable values are ...- nlat: 305
- nlon: 1301
- time: 1
- z_t: 62
- z_w: 62
- z_w_bot: 62
- z_w_top: 62
- time(time)object0036-12-07 00:00:00
- long_name :
- time
- bounds :
- time_bound
array([cftime.DatetimeNoLeap(36, 12, 7, 0, 0, 0, 0)], dtype=object)
- z_t(z_t)float32500.0 1.5e+03 ... 5.875e+05
- long_name :
- depth from surface to midpoint of layer
- units :
- centimeters
- positive :
- down
- valid_min :
- 500.0
- valid_max :
- 587499.06
array([5.000000e+02, 1.500000e+03, 2.500000e+03, 3.500000e+03, 4.500000e+03, 5.500000e+03, 6.500000e+03, 7.500000e+03, 8.500000e+03, 9.500000e+03, 1.050000e+04, 1.150000e+04, 1.250000e+04, 1.350000e+04, 1.450000e+04, 1.550000e+04, 1.650984e+04, 1.754790e+04, 1.862913e+04, 1.976603e+04, 2.097114e+04, 2.225783e+04, 2.364088e+04, 2.513702e+04, 2.676542e+04, 2.854837e+04, 3.051192e+04, 3.268680e+04, 3.510935e+04, 3.782276e+04, 4.087846e+04, 4.433777e+04, 4.827367e+04, 5.277280e+04, 5.793729e+04, 6.388626e+04, 7.075633e+04, 7.870025e+04, 8.788252e+04, 9.847059e+04, 1.106204e+05, 1.244567e+05, 1.400497e+05, 1.573946e+05, 1.764003e+05, 1.968944e+05, 2.186457e+05, 2.413972e+05, 2.649001e+05, 2.889385e+05, 3.133405e+05, 3.379793e+05, 3.627670e+05, 3.876452e+05, 4.125768e+05, 4.375392e+05, 4.625190e+05, 4.875083e+05, 5.125028e+05, 5.375000e+05, 5.624991e+05, 5.874991e+05], dtype=float32) - z_w(z_w)float320.0 1e+03 ... 5.5e+05 5.75e+05
- long_name :
- depth from surface to top of layer
- units :
- centimeters
- positive :
- down
- valid_min :
- 0.0
- valid_max :
- 574999.06
array([ 0. , 1000. , 2000. , 3000. , 4000. , 5000. , 6000. , 7000. , 8000. , 9000. , 10000. , 11000. , 12000. , 13000. , 14000. , 15000. , 16000. , 17019.682, 18076.129, 19182.125, 20349.932, 21592.344, 22923.312, 24358.453, 25915.58 , 27615.26 , 29481.47 , 31542.373, 33831.227, 36387.473, 39258.047, 42498.887, 46176.656, 50370.688, 55174.91 , 60699.668, 67072.86 , 74439.805, 82960.695, 92804.35 , 104136.82 , 117104.016, 131809.36 , 148290.08 , 166499.2 , 186301.44 , 207487.39 , 229803.9 , 252990.4 , 276809.84 , 301067.06 , 325613.84 , 350344.88 , 375189.2 , 400101.16 , 425052.47 , 450026.06 , 475012. , 500004.7 , 525000.94 , 549999.06 , 574999.06 ], dtype=float32) - z_w_top(z_w_top)float320.0 1e+03 ... 5.5e+05 5.75e+05
- long_name :
- depth from surface to top of layer
- units :
- centimeters
- positive :
- down
- valid_min :
- 0.0
- valid_max :
- 574999.06
array([ 0. , 1000. , 2000. , 3000. , 4000. , 5000. , 6000. , 7000. , 8000. , 9000. , 10000. , 11000. , 12000. , 13000. , 14000. , 15000. , 16000. , 17019.682, 18076.129, 19182.125, 20349.932, 21592.344, 22923.312, 24358.453, 25915.58 , 27615.26 , 29481.47 , 31542.373, 33831.227, 36387.473, 39258.047, 42498.887, 46176.656, 50370.688, 55174.91 , 60699.668, 67072.86 , 74439.805, 82960.695, 92804.35 , 104136.82 , 117104.016, 131809.36 , 148290.08 , 166499.2 , 186301.44 , 207487.39 , 229803.9 , 252990.4 , 276809.84 , 301067.06 , 325613.84 , 350344.88 , 375189.2 , 400101.16 , 425052.47 , 450026.06 , 475012. , 500004.7 , 525000.94 , 549999.06 , 574999.06 ], dtype=float32) - z_w_bot(z_w_bot)float321e+03 2e+03 ... 5.75e+05 6e+05
- long_name :
- depth from surface to bottom of layer
- units :
- centimeters
- positive :
- down
- valid_min :
- 1000.0
- valid_max :
- 599999.06
array([ 1000. , 2000. , 3000. , 4000. , 5000. , 6000. , 7000. , 8000. , 9000. , 10000. , 11000. , 12000. , 13000. , 14000. , 15000. , 16000. , 17019.682, 18076.129, 19182.125, 20349.932, 21592.344, 22923.312, 24358.453, 25915.58 , 27615.26 , 29481.47 , 31542.373, 33831.227, 36387.473, 39258.047, 42498.887, 46176.656, 50370.688, 55174.91 , 60699.668, 67072.86 , 74439.805, 82960.695, 92804.35 , 104136.82 , 117104.016, 131809.36 , 148290.08 , 166499.2 , 186301.44 , 207487.39 , 229803.9 , 252990.4 , 276809.84 , 301067.06 , 325613.84 , 350344.88 , 375189.2 , 400101.16 , 425052.47 , 450026.06 , 475012. , 500004.7 , 525000.94 , 549999.06 , 574999.06 , 599999.06 ], dtype=float32) - ULONG(nlat, nlon)float64...
- long_name :
- array of u-grid longitudes
- units :
- degrees_east
[396805 values with dtype=float64]
- ULAT(nlat, nlon)float64...
- long_name :
- array of u-grid latitudes
- units :
- degrees_north
[396805 values with dtype=float64]
- TLONG(nlat, nlon)float64...
- long_name :
- array of t-grid longitudes
- units :
- degrees_east
[396805 values with dtype=float64]
- TLAT(nlat, nlon)float64...
- long_name :
- array of t-grid latitudes
- units :
- degrees_north
[396805 values with dtype=float64]
- TEND_TEMP(time, z_t, nlat, nlon)float32...
- long_name :
- Tendency of Thickness Weighted TEMP
- units :
- degC/s
- grid_loc :
- 3111
- cell_methods :
- time: mean
[24601910 values with dtype=float32]
- UET(time, z_t, nlat, nlon)float32...
- long_name :
- Flux of Heat in grid-x direction
- units :
- degC/s
- grid_loc :
- 3211
- cell_methods :
- time: mean
[24601910 values with dtype=float32]
- VNT(time, z_t, nlat, nlon)float32...
- long_name :
- Flux of Heat in grid-y direction
- units :
- degC/s
- grid_loc :
- 3121
- cell_methods :
- time: mean
[24601910 values with dtype=float32]
- WTT(time, z_w_top, nlat, nlon)float32...
- long_name :
- Heat Flux Across Top Face
- units :
- degC/s
- grid_loc :
- 3112
- cell_methods :
- time: mean
[24601910 values with dtype=float32]
- KPP_SRC_TEMP(time, z_t, nlat, nlon)float32...
- long_name :
- TEMP tendency from KPP non local mixing term
- units :
- degC/s
- grid_loc :
- 3111
- cell_methods :
- time: mean
[24601910 values with dtype=float32]
- UVEL(time, z_t, nlat, nlon)float32...
- long_name :
- Velocity in grid-x direction
- units :
- centimeter/s
- grid_loc :
- 3221
- cell_methods :
- time: mean
[24601910 values with dtype=float32]
- VVEL(time, z_t, nlat, nlon)float32...
- long_name :
- Velocity in grid-y direction
- units :
- centimeter/s
- grid_loc :
- 3221
- cell_methods :
- time: mean
[24601910 values with dtype=float32]
- WVEL(time, z_w_top, nlat, nlon)float32...
- long_name :
- Vertical Velocity
- units :
- centimeter/s
- grid_loc :
- 3112
- cell_methods :
- time: mean
[24601910 values with dtype=float32]
- TEMP(time, z_t, nlat, nlon)float32...
- long_name :
- Potential Temperature
- units :
- degC
- grid_loc :
- 3111
- cell_methods :
- time: mean
[24601910 values with dtype=float32]
- DXT(nlat, nlon)float64...
- long_name :
- x-spacing centered at T points
- units :
- centimeters
[396805 values with dtype=float64]
- DXU(nlat, nlon)float64...
- long_name :
- x-spacing centered at U points
- units :
- centimeters
[396805 values with dtype=float64]
- DYT(nlat, nlon)float64...
- long_name :
- y-spacing centered at T points
- units :
- centimeters
[396805 values with dtype=float64]
- DYU(nlat, nlon)float64...
- long_name :
- y-spacing centered at U points
- units :
- centimeters
[396805 values with dtype=float64]
- TAREA(nlat, nlon)float64...
- long_name :
- area of T cells
- units :
- centimeter^2
[396805 values with dtype=float64]
- UAREA(nlat, nlon)float64...
- long_name :
- area of U cells
- units :
- centimeter^2
[396805 values with dtype=float64]
- QSW_3D(time, z_w_top, nlat, nlon)float32...
- long_name :
- Solar Short-Wave Heat Flux
- units :
- watt/m^2
- grid_loc :
- 3112
- cell_methods :
- time: mean
[24601910 values with dtype=float32]
- HDIFE_TEMP(time, z_t, nlat, nlon)float32...
- long_name :
- TEMP Horizontal Diffusive Flux in grid-x direction
- units :
- degC/s
- grid_loc :
- 3211
- cell_methods :
- time: mean
[24601910 values with dtype=float32]
- HDIFN_TEMP(time, z_t, nlat, nlon)float32...
- long_name :
- TEMP Horizontal Diffusive Flux in grid-y direction
- units :
- degC/s
- grid_loc :
- 3121
- cell_methods :
- time: mean
[24601910 values with dtype=float32]
- dz(z_t)float32...
- long_name :
- thickness of layer k
- units :
- centimeters
array([ 1000. , 1000. , 1000. , 1000. , 1000. , 1000. , 1000. , 1000. , 1000. , 1000. , 1000. , 1000. , 1000. , 1000. , 1000. , 1000. , 1019.6808, 1056.4484, 1105.9951, 1167.807 , 1242.4133, 1330.9678, 1435.141 , 1557.1259, 1699.6796, 1866.2124, 2060.9023, 2288.852 , 2556.247 , 2870.575 , 3240.8372, 3677.7725, 4194.031 , 4804.2236, 5524.7544, 6373.192 , 7366.945 , 8520.893 , 9843.658 , 11332.466 , 12967.199 , 14705.344 , 16480.709 , 18209.135 , 19802.234 , 21185.957 , 22316.51 , 23186.494 , 23819.45 , 24257.217 , 24546.78 , 24731.014 , 24844.328 , 24911.975 , 24951.291 , 24973.594 , 24985.96 , 24992.674 , 24996.244 , 24998.11 , 25000. , 25000. ], dtype=float32) - dzw(z_w)float32...
- long_name :
- midpoint of k to midpoint of k+1
- units :
- centimeters
array([ 500. , 1000. , 1000. , 1000. , 1000. , 1000. , 1000. , 1000. , 1000. , 1000. , 1000. , 1000. , 1000. , 1000. , 1000. , 1000. , 1009.8404, 1038.0646, 1081.2218, 1136.901 , 1205.1101, 1286.6906, 1383.0544, 1496.1334, 1628.4027, 1782.946 , 1963.5574, 2174.8772, 2422.5496, 2713.4111, 3055.706 , 3459.305 , 3935.9016, 4499.1274, 5164.489 , 5948.973 , 6870.0684, 7943.9185, 9182.275 , 10588.062 , 12149.832 , 13836.271 , 15593.026 , 17344.922 , 19005.686 , 20494.096 , 21751.234 , 22751.502 , 23502.97 , 24038.332 , 24401.998 , 24638.896 , 24787.672 , 24878.15 , 24931.633 , 24962.443 , 24979.777 , 24989.316 , 24994.459 , 24997.176 , 24999.055 , 25000. ], dtype=float32) - hflux_factor()float64...
- long_name :
- Convert Heat and Solar Flux to Temperature Flux
array(2.439086e-05)
- KMT(nlat, nlon)float64...
- long_name :
- k Index of Deepest Grid Cell on T Grid
[396805 values with dtype=float64]
- KMU(nlat, nlon)float64...
- long_name :
- k Index of Deepest Grid Cell on U Grid
[396805 values with dtype=float64]
- DIA_IMPVF_TEMP(time, z_w_bot, nlat, nlon)float32...
- long_name :
- TEMP Flux Across Bottom Face from Diabatic Implicit Vertical Mixing
- units :
- degC cm/s
- grid_loc :
- 3113
- cell_methods :
- time: mean
[24601910 values with dtype=float32]
- SHF(time, nlat, nlon)float32...
- long_name :
- Total Surface Heat Flux, Including SW
- units :
- watt/m^2
- grid_loc :
- 2110
- cell_methods :
- time: mean
[396805 values with dtype=float32]
- SHF_QSW(time, nlat, nlon)float32...
- long_name :
- Solar Short-Wave Heat Flux
- units :
- watt/m^2
- grid_loc :
- 2110
- cell_methods :
- time: mean
[396805 values with dtype=float32]
- DZT(z_t, nlat, nlon)float32...
- longname :
- T-grid cell thickness
- units :
- cm
[24601910 values with dtype=float32]
- DZU(z_t, nlat, nlon)float32...
- longname :
- U-grid cell thickness
- units :
- cm
[24601910 values with dtype=float32]
- cell_volume_t(z_t, nlat, nlon)float641.153e+15 1.153e+15 ... 2.884e+16
array([[[1.15269658e+15, 1.15269658e+15, 1.15269658e+15, ..., 1.15269658e+15, 1.15269658e+15, 1.15269658e+15], [1.15373884e+15, 1.15373884e+15, 1.15373884e+15, ..., 1.15373884e+15, 1.15373884e+15, 1.15373884e+15], [1.15477548e+15, 1.15477548e+15, 1.15477548e+15, ..., 1.15477548e+15, 1.15477548e+15, 1.15477548e+15], ..., [1.15580645e+15, 1.15580645e+15, 1.15580645e+15, ..., 1.15580645e+15, 1.15580645e+15, 1.15580645e+15], [1.15477547e+15, 1.15477547e+15, 1.15477547e+15, ..., 1.15477547e+15, 1.15477547e+15, 1.15477547e+15], [1.15373883e+15, 1.15373883e+15, 1.15373883e+15, ..., 1.15373883e+15, 1.15373883e+15, 1.15373883e+15]], [[1.15269658e+15, 1.15269658e+15, 1.15269658e+15, ..., 1.15269658e+15, 1.15269658e+15, 1.15269658e+15], [1.15373884e+15, 1.15373884e+15, 1.15373884e+15, ..., 1.15373884e+15, 1.15373884e+15, 1.15373884e+15], [1.15477548e+15, 1.15477548e+15, 1.15477548e+15, ..., 1.15477548e+15, 1.15477548e+15, 1.15477548e+15], ... [2.88951613e+16, 2.88951613e+16, 2.88951613e+16, ..., 2.88951613e+16, 2.88951613e+16, 2.88951613e+16], [2.88693867e+16, 2.88693867e+16, 2.88693867e+16, ..., 2.88693867e+16, 2.88693867e+16, 2.88693867e+16], [2.88434708e+16, 2.88434708e+16, 2.88434708e+16, ..., 2.88434708e+16, 2.88434708e+16, 2.88434708e+16]], [[2.88174145e+16, 2.88174145e+16, 2.88174145e+16, ..., 2.88174145e+16, 2.88174145e+16, 2.88174145e+16], [2.88434711e+16, 2.88434711e+16, 2.88434711e+16, ..., 2.88434711e+16, 2.88434711e+16, 2.88434711e+16], [2.88693870e+16, 2.88693870e+16, 2.88693870e+16, ..., 2.88693870e+16, 2.88693870e+16, 2.88693870e+16], ..., [2.88951613e+16, 2.88951613e+16, 2.88951613e+16, ..., 2.88951613e+16, 2.88951613e+16, 2.88951613e+16], [2.88693867e+16, 2.88693867e+16, 2.88693867e+16, ..., 2.88693867e+16, 2.88693867e+16, 2.88693867e+16], [2.88434708e+16, 2.88434708e+16, 2.88434708e+16, ..., 2.88434708e+16, 2.88434708e+16, 2.88434708e+16]]]) - cell_volume_u(z_t, nlat, nlon)float641.153e+15 1.153e+15 ... 2.884e+16
array([[[1.15269658e+15, 1.15269658e+15, 1.15269658e+15, ...,
         1.15269658e+15, 1.15269658e+15, 1.15269658e+15],
        [1.15373884e+15, 1.15373884e+15, 1.15373884e+15, ...,
         1.15373884e+15, 1.15373884e+15, 1.15373884e+15],
        [1.15477548e+15, 1.15477548e+15, 1.15477548e+15, ...,
         1.15477548e+15, 1.15477548e+15, 1.15477548e+15],
        ...,
        [1.15580645e+15, 1.15580645e+15, 1.15580645e+15, ...,
         1.15580645e+15, 1.15580645e+15, 1.15580645e+15],
        [1.15477547e+15, 1.15477547e+15, 1.15477547e+15, ...,
         1.15477547e+15, 1.15477547e+15, 1.15477547e+15],
        [1.15373883e+15, 1.15373883e+15, 1.15373883e+15, ...,
         1.15373883e+15, 1.15373883e+15, 1.15373883e+15]],

       [[1.15269658e+15, 1.15269658e+15, 1.15269658e+15, ...,
         1.15269658e+15, 1.15269658e+15, 1.15269658e+15],
        [1.15373884e+15, 1.15373884e+15, 1.15373884e+15, ...,
         1.15373884e+15, 1.15373884e+15, 1.15373884e+15],
        [1.15477548e+15, 1.15477548e+15, 1.15477548e+15, ...,
         1.15477548e+15, 1.15477548e+15, 1.15477548e+15],
...
        [2.88951613e+16, 2.88951613e+16, 2.88951613e+16, ...,
         2.88951613e+16, 2.88951613e+16, 2.88951613e+16],
        [2.88693867e+16, 2.88693867e+16, 2.88693867e+16, ...,
         2.88693867e+16, 2.88693867e+16, 2.88693867e+16],
        [2.88434708e+16, 2.88434708e+16, 2.88434708e+16, ...,
         2.88434708e+16, 2.88434708e+16, 2.88434708e+16]],

       [[2.88174145e+16, 2.88174145e+16, 2.88174145e+16, ...,
         2.88174145e+16, 2.88174145e+16, 2.88174145e+16],
        [2.88434711e+16, 2.88434711e+16, 2.88434711e+16, ...,
         2.88434711e+16, 2.88434711e+16, 2.88434711e+16],
        [2.88693870e+16, 2.88693870e+16, 2.88693870e+16, ...,
         2.88693870e+16, 2.88693870e+16, 2.88693870e+16],
        ...,
        [2.88951613e+16, 2.88951613e+16, 2.88951613e+16, ...,
         2.88951613e+16, 2.88951613e+16, 2.88951613e+16],
        [2.88693867e+16, 2.88693867e+16, 2.88693867e+16, ...,
         2.88693867e+16, 2.88693867e+16, 2.88693867e+16],
        [2.88434708e+16, 2.88434708e+16, 2.88434708e+16, ...,
         2.88434708e+16, 2.88434708e+16, 2.88434708e+16]]])
- title :
- g.e20.G.TL319_t13.control.001_hfreq
- history :
- none
- Conventions :
- CF-1.0; http://www.cgd.ucar.edu/cms/eaton/netcdf/CF-current.htm
- time_period_freq :
- day_5
- model_doi_url :
- https://doi.org/10.5065/D67H1H0V
- contents :
- Diagnostic and Prognostic Variables
- source :
- CCSM POP2, the CCSM Ocean Component
- revision :
- $Id: tavg.F90 89091 2018-04-30 15:58:32Z altuntas@ucar.edu $
- calendar :
- All years have exactly 365 days.
- start_time :
- This dataset was created on 2018-12-14 at 16:05:58.8
- cell_methods :
- cell_methods = time: mean ==> the variable values are averaged over the time interval between the previous time coordinate and the current one. cell_methods absent ==> the variable values are at the time given by the current time coordinate.
We call to_xgcm_grid_dataset() to make the POP dataset xgcm compatible. This means that the dimensions need to be renamed so that xgcm knows which variables are at T-points and which are at U-points.
grid, ds_ren = pop_tools.to_xgcm_grid_dataset(ds, periodic=False)
ds_ren contains all variables from ds, but nlat/nlon have been replaced by nlat_t/nlon_t and nlat_u/nlon_u depending on which points the variables are at:
ds_ren
<xarray.Dataset>
Dimensions:         (nlat: 305, nlat_t: 305, nlat_u: 305, nlon: 1301, nlon_t: 1301, nlon_u: 1301, time: 1, z_t: 62, z_w_bot: 62, z_w_top: 62)
Coordinates:
  * time            (time) object 0036-12-07 00:00:00
  * z_t             (z_t) float32 500.0 1.5e+03 2.5e+03 ... 5.625e+05 5.875e+05
  * z_w_top         (z_w_top) float32 0.0 1e+03 2e+03 ... 5.5e+05 5.75e+05
  * z_w_bot         (z_w_bot) float32 1e+03 2e+03 3e+03 ... 5.75e+05 6e+05
    ULONG           (nlat_u, nlon_u) float64 160.0 160.1 160.2 ... -70.1 -70.0
    ULAT            (nlat_u, nlon_u) float64 -15.03 -15.03 ... 15.03 15.03
    TLONG           (nlat_t, nlon_t) float64 159.9 160.0 160.1 ... 289.9 290.0
    TLAT            (nlat_t, nlon_t) float64 -15.07 -15.07 ... 14.98 14.98
  * nlon_u          (nlon_u) int64 1 2 3 4 5 6 ... 1296 1297 1298 1299 1300 1301
  * nlat_u          (nlat_u) int64 1 2 3 4 5 6 7 ... 299 300 301 302 303 304 305
  * nlon_t          (nlon_t) float64 0.5 1.5 2.5 ... 1.298e+03 1.3e+03 1.3e+03
  * nlat_t          (nlat_t) float64 0.5 1.5 2.5 3.5 ... 301.5 302.5 303.5 304.5
Dimensions without coordinates: nlat, nlon
Data variables: (12/30)
    TEND_TEMP       (time, z_t, nlat_t, nlon_t) float32 3.461e-08 ... nan
    UET             (time, z_t, nlat_t, nlon_u) float32 -0.0005898 ... 0.0
    VNT             (time, z_t, nlat_u, nlon_t) float32 0.0002135 ... 0.0
    WTT             (time, z_w_top, nlat_t, nlon_t) float32 0.0 0.0 ... nan nan
    KPP_SRC_TEMP    (time, z_t, nlat_t, nlon_t) float32 1.908e-06 ... nan
    UVEL            (time, z_t, nlat_u, nlon_u) float32 -23.85 -25.17 ... nan
    ...              ...
    SHF             (time, nlat_t, nlon_t) float32 94.64 96.18 ... -58.45 -58.65
    SHF_QSW         (time, nlat_t, nlon_t) float32 245.0 245.2 ... 204.0 203.9
    DZT             (z_t, nlat_t, nlon_t) float32 1e+03 1e+03 ... 2.5e+04
    DZU             (z_t, nlat_u, nlon_u) float32 1e+03 1e+03 ... 2.5e+04
    cell_volume_t   (z_t, nlat, nlon) float64 1.153e+15 1.153e+15 ... 2.884e+16
    cell_volume_u   (z_t, nlat, nlon) float64 1.153e+15 1.153e+15 ... 2.884e+16
Attributes:
    title:             g.e20.G.TL319_t13.control.001_hfreq
    history:           none
    Conventions:       CF-1.0; http://www.cgd.ucar.edu/cms/eaton/netcdf/CF-cu...
    time_period_freq:  day_5
    model_doi_url:     https://doi.org/10.5065/D67H1H0V
    contents:          Diagnostic and Prognostic Variables
    source:            CCSM POP2, the CCSM Ocean Component
    revision:          $Id: tavg.F90 89091 2018-04-30 15:58:32Z altuntas@ucar...
    calendar:          All years have exactly  365 days.
    start_time:        This dataset was created on 2018-12-14 at 16:05:58.8
cell_methods: cell_methods = time: mean ==> the variable values are ...- nlat: 305
- nlat_t: 305
- nlat_u: 305
- nlon: 1301
- nlon_t: 1301
- nlon_u: 1301
- time: 1
- z_t: 62
- z_w_bot: 62
- z_w_top: 62
- time(time)object0036-12-07 00:00:00
- long_name :
- time
- bounds :
- time_bound
array([cftime.DatetimeNoLeap(36, 12, 7, 0, 0, 0, 0)], dtype=object)
- z_t(z_t)float32500.0 1.5e+03 ... 5.875e+05
- long_name :
- depth from surface to midpoint of layer
- units :
- centimeters
- positive :
- down
- valid_min :
- 500.0
- valid_max :
- 587499.06
- axis :
- Z
array([5.000000e+02, 1.500000e+03, 2.500000e+03, 3.500000e+03, 4.500000e+03, 5.500000e+03, 6.500000e+03, 7.500000e+03, 8.500000e+03, 9.500000e+03, 1.050000e+04, 1.150000e+04, 1.250000e+04, 1.350000e+04, 1.450000e+04, 1.550000e+04, 1.650984e+04, 1.754790e+04, 1.862913e+04, 1.976603e+04, 2.097114e+04, 2.225783e+04, 2.364088e+04, 2.513702e+04, 2.676542e+04, 2.854837e+04, 3.051192e+04, 3.268680e+04, 3.510935e+04, 3.782276e+04, 4.087846e+04, 4.433777e+04, 4.827367e+04, 5.277280e+04, 5.793729e+04, 6.388626e+04, 7.075633e+04, 7.870025e+04, 8.788252e+04, 9.847059e+04, 1.106204e+05, 1.244567e+05, 1.400497e+05, 1.573946e+05, 1.764003e+05, 1.968944e+05, 2.186457e+05, 2.413972e+05, 2.649001e+05, 2.889385e+05, 3.133405e+05, 3.379793e+05, 3.627670e+05, 3.876452e+05, 4.125768e+05, 4.375392e+05, 4.625190e+05, 4.875083e+05, 5.125028e+05, 5.375000e+05, 5.624991e+05, 5.874991e+05], dtype=float32) - z_w_top(z_w_top)float320.0 1e+03 ... 5.5e+05 5.75e+05
- long_name :
- depth from surface to top of layer
- units :
- centimeters
- positive :
- down
- valid_min :
- 0.0
- valid_max :
- 574999.06
- axis :
- Z
- c_grid_axis_shift :
- -0.5
array([ 0. , 1000. , 2000. , 3000. , 4000. , 5000. , 6000. , 7000. , 8000. , 9000. , 10000. , 11000. , 12000. , 13000. , 14000. , 15000. , 16000. , 17019.682, 18076.129, 19182.125, 20349.932, 21592.344, 22923.312, 24358.453, 25915.58 , 27615.26 , 29481.47 , 31542.373, 33831.227, 36387.473, 39258.047, 42498.887, 46176.656, 50370.688, 55174.91 , 60699.668, 67072.86 , 74439.805, 82960.695, 92804.35 , 104136.82 , 117104.016, 131809.36 , 148290.08 , 166499.2 , 186301.44 , 207487.39 , 229803.9 , 252990.4 , 276809.84 , 301067.06 , 325613.84 , 350344.88 , 375189.2 , 400101.16 , 425052.47 , 450026.06 , 475012. , 500004.7 , 525000.94 , 549999.06 , 574999.06 ], dtype=float32) - z_w_bot(z_w_bot)float321e+03 2e+03 ... 5.75e+05 6e+05
- long_name :
- depth from surface to bottom of layer
- units :
- centimeters
- positive :
- down
- valid_min :
- 1000.0
- valid_max :
- 599999.06
- axis :
- Z
- c_grid_axis_shift :
- 0.5
array([ 1000. , 2000. , 3000. , 4000. , 5000. , 6000. , 7000. , 8000. , 9000. , 10000. , 11000. , 12000. , 13000. , 14000. , 15000. , 16000. , 17019.682, 18076.129, 19182.125, 20349.932, 21592.344, 22923.312, 24358.453, 25915.58 , 27615.26 , 29481.47 , 31542.373, 33831.227, 36387.473, 39258.047, 42498.887, 46176.656, 50370.688, 55174.91 , 60699.668, 67072.86 , 74439.805, 82960.695, 92804.35 , 104136.82 , 117104.016, 131809.36 , 148290.08 , 166499.2 , 186301.44 , 207487.39 , 229803.9 , 252990.4 , 276809.84 , 301067.06 , 325613.84 , 350344.88 , 375189.2 , 400101.16 , 425052.47 , 450026.06 , 475012. , 500004.7 , 525000.94 , 549999.06 , 574999.06 , 599999.06 ], dtype=float32) - ULONG(nlat_u, nlon_u)float64160.0 160.1 160.2 ... -70.1 -70.0
- long_name :
- array of u-grid longitudes
- units :
- degrees_east
- grid_loc :
- 2220
array([[160. , 160.1, 160.2, ..., -70.2, -70.1, -70. ], [160. , 160.1, 160.2, ..., -70.2, -70.1, -70. ], [160. , 160.1, 160.2, ..., -70.2, -70.1, -70. ], ..., [160. , 160.1, 160.2, ..., -70.2, -70.1, -70. ], [160. , 160.1, 160.2, ..., -70.2, -70.1, -70. ], [160. , 160.1, 160.2, ..., -70.2, -70.1, -70. ]]) - ULAT(nlat_u, nlon_u)float64-15.03 -15.03 ... 15.03 15.03
- long_name :
- array of u-grid latitudes
- units :
- degrees_north
- grid_loc :
- 2220
array([[-15.02645786, -15.02645786, -15.02645786, ..., -15.02645786, -15.02645786, -15.02645786], [-14.92983365, -14.92983365, -14.92983365, ..., -14.92983365, -14.92983365, -14.92983365], [-14.83316612, -14.83316612, -14.83316612, ..., -14.83316612, -14.83316612, -14.83316612], ..., [ 14.83316612, 14.83316612, 14.83316612, ..., 14.83316612, 14.83316612, 14.83316612], [ 14.92983365, 14.92983365, 14.92983365, ..., 14.92983365, 14.92983365, 14.92983365], [ 15.02645786, 15.02645786, 15.02645786, ..., 15.02645786, 15.02645786, 15.02645786]]) - TLONG(nlat_t, nlon_t)float64159.9 160.0 160.1 ... 289.9 290.0
- long_name :
- array of t-grid longitudes
- units :
- degrees_east
- grid_loc :
- 2110
array([[159.95, 160.05, 160.15, ..., 289.75, 289.85, 289.95], [159.95, 160.05, 160.15, ..., 289.75, 289.85, 289.95], [159.95, 160.05, 160.15, ..., 289.75, 289.85, 289.95], ..., [159.95, 160.05, 160.15, ..., 289.75, 289.85, 289.95], [159.95, 160.05, 160.15, ..., 289.75, 289.85, 289.95], [159.95, 160.05, 160.15, ..., 289.75, 289.85, 289.95]]) - TLAT(nlat_t, nlon_t)float64-15.07 -15.07 ... 14.98 14.98
- long_name :
- array of t-grid latitudes
- units :
- degrees_north
- grid_loc :
- 2110
array([[-15.07475365, -15.07475365, -15.07475365, ..., -15.07475365, -15.07475365, -15.07475365], [-14.9781512 , -14.9781512 , -14.9781512 , ..., -14.9781512 , -14.9781512 , -14.9781512 ], [-14.8815053 , -14.8815053 , -14.8815053 , ..., -14.8815053 , -14.8815053 , -14.8815053 ], ..., [ 14.7848162 , 14.7848162 , 14.7848162 , ..., 14.7848162 , 14.7848162 , 14.7848162 ], [ 14.8815053 , 14.8815053 , 14.8815053 , ..., 14.8815053 , 14.8815053 , 14.8815053 ], [ 14.9781512 , 14.9781512 , 14.9781512 , ..., 14.9781512 , 14.9781512 , 14.9781512 ]]) - nlon_u(nlon_u)int641 2 3 4 5 ... 1298 1299 1300 1301
- axis :
- X
- c_grid_axis_shift :
- 0.5
array([ 1, 2, 3, ..., 1299, 1300, 1301])
- nlat_u(nlat_u)int641 2 3 4 5 6 ... 301 302 303 304 305
- axis :
- Y
- c_grid_axis_shift :
- 0.5
array([ 1, 2, 3, ..., 303, 304, 305])
- nlon_t(nlon_t)float640.5 1.5 2.5 ... 1.3e+03 1.3e+03
- axis :
- X
array([5.0000e-01, 1.5000e+00, 2.5000e+00, ..., 1.2985e+03, 1.2995e+03, 1.3005e+03]) - nlat_t(nlat_t)float640.5 1.5 2.5 ... 302.5 303.5 304.5
- axis :
- Y
array([ 0.5, 1.5, 2.5, ..., 302.5, 303.5, 304.5])
- TEND_TEMP(time, z_t, nlat_t, nlon_t)float323.461e-08 1.807e-07 ... nan nan
- long_name :
- Tendency of Thickness Weighted TEMP
- units :
- degC/s
- grid_loc :
- 3111
- cell_methods :
- time: mean
array([[[[ 3.46056268e-08, 1.80671279e-07, 3.91672614e-07, ..., nan, nan, nan], [ 1.07943237e-07, 2.19586965e-07, 4.52391362e-07, ..., nan, nan, nan], [ 1.87353976e-07, 2.62796334e-07, 4.38701051e-07, ..., nan, nan, nan], ..., [-5.05511139e-07, -5.02081321e-07, -4.98360805e-07, ..., -3.52250538e-07, -3.63505791e-07, -3.83077492e-07], [-4.98683903e-07, -5.19817377e-07, -5.05030414e-07, ..., -4.38479049e-07, -4.63021735e-07, -4.81695849e-07], [-4.76793872e-07, -5.49971105e-07, -5.56377131e-07, ..., -6.85790781e-07, -6.69126791e-07, -6.57019712e-07]], [[ 5.79335122e-08, 2.13767976e-07, 4.34827967e-07, ..., nan, nan, nan], [ 1.49679650e-07, 2.73230540e-07, 5.11472706e-07, ..., nan, nan, nan], [ 2.54681225e-07, 3.41973958e-07, 5.21864706e-07, ..., nan, nan, nan], ... nan, nan, nan], [ nan, nan, nan, ..., nan, nan, nan], [ nan, nan, nan, ..., nan, nan, nan]], [[ nan, nan, nan, ..., nan, nan, nan], [ nan, nan, nan, ..., nan, nan, nan], [ nan, nan, nan, ..., nan, nan, nan], ..., [ nan, nan, nan, ..., nan, nan, nan], [ nan, nan, nan, ..., nan, nan, nan], [ nan, nan, nan, ..., nan, nan, nan]]]], dtype=float32) - UET(time, z_t, nlat_t, nlon_u)float32-0.0005898 -0.0006306 ... 0.0 0.0
- long_name :
- Flux of Heat in grid-x direction
- units :
- degC/s
- grid_loc :
- 3211
- cell_methods :
- time: mean
array([[[[-5.8981479e-04, -6.3058845e-04, -6.4141728e-04, ..., 0.0000000e+00, 0.0000000e+00, 0.0000000e+00], [-5.9510104e-04, -6.1750511e-04, -6.0868193e-04, ..., 0.0000000e+00, 0.0000000e+00, 0.0000000e+00], [-5.8199256e-04, -5.8142096e-04, -5.5241393e-04, ..., 0.0000000e+00, 0.0000000e+00, 0.0000000e+00], ..., [-4.2903060e-04, -4.3390927e-04, -4.3888713e-04, ..., -6.2893907e-04, -5.6909444e-04, -5.1800814e-04], [-4.1530357e-04, -4.1823235e-04, -4.2217842e-04, ..., -5.8426487e-04, -5.2095583e-04, -4.6718909e-04], [-4.0400936e-04, -4.0720709e-04, -4.1103581e-04, ..., -4.5888204e-04, -3.8409504e-04, -3.2267402e-04]], [[-4.7394997e-04, -5.1249319e-04, -5.2131998e-04, ..., 0.0000000e+00, 0.0000000e+00, 0.0000000e+00], [-4.7892897e-04, -4.9894466e-04, -4.8816449e-04, ..., 0.0000000e+00, 0.0000000e+00, 0.0000000e+00], [-4.6519880e-04, -4.6245463e-04, -4.3177954e-04, ..., 0.0000000e+00, 0.0000000e+00, 0.0000000e+00], ... 0.0000000e+00, 0.0000000e+00, 0.0000000e+00], [ 0.0000000e+00, 0.0000000e+00, 0.0000000e+00, ..., 0.0000000e+00, 0.0000000e+00, 0.0000000e+00], [ 0.0000000e+00, 0.0000000e+00, 0.0000000e+00, ..., 0.0000000e+00, 0.0000000e+00, 0.0000000e+00]], [[ 0.0000000e+00, 0.0000000e+00, 0.0000000e+00, ..., 0.0000000e+00, 0.0000000e+00, 0.0000000e+00], [ 0.0000000e+00, 0.0000000e+00, 0.0000000e+00, ..., 0.0000000e+00, 0.0000000e+00, 0.0000000e+00], [ 0.0000000e+00, 0.0000000e+00, 0.0000000e+00, ..., 0.0000000e+00, 0.0000000e+00, 0.0000000e+00], ..., [ 0.0000000e+00, 0.0000000e+00, 0.0000000e+00, ..., 0.0000000e+00, 0.0000000e+00, 0.0000000e+00], [ 0.0000000e+00, 0.0000000e+00, 0.0000000e+00, ..., 0.0000000e+00, 0.0000000e+00, 0.0000000e+00], [ 0.0000000e+00, 0.0000000e+00, 0.0000000e+00, ..., 0.0000000e+00, 0.0000000e+00, 0.0000000e+00]]]], dtype=float32) - VNT(time, z_t, nlat_u, nlon_t)float320.0002135 0.0003014 ... 0.0 0.0
- long_name :
- Flux of Heat in grid-y direction
- units :
- degC/s
- grid_loc :
- 3121
- cell_methods :
- time: mean
array([[[[2.1350103e-04, 3.0143379e-04, 3.7243063e-04, ..., 0.0000000e+00, 0.0000000e+00, 0.0000000e+00], [2.5610928e-04, 3.2313386e-04, 3.6535595e-04, ..., 0.0000000e+00, 0.0000000e+00, 0.0000000e+00], [2.7839895e-04, 3.2335037e-04, 3.3868832e-04, ..., 0.0000000e+00, 0.0000000e+00, 0.0000000e+00], ..., [2.1069360e-04, 2.0842761e-04, 2.0460520e-04, ..., 1.8333115e-04, 1.3123237e-04, 9.0971334e-05], [2.1445459e-04, 2.1139412e-04, 2.0719666e-04, ..., 9.8215547e-05, 5.9192793e-05, 3.2206332e-05], [2.2025200e-04, 2.1503893e-04, 2.0926520e-04, ..., 4.4906563e-05, 2.3912924e-05, 1.5640782e-05]], [[1.9981392e-04, 2.8854058e-04, 3.6127935e-04, ..., 0.0000000e+00, 0.0000000e+00, 0.0000000e+00], [2.4306485e-04, 3.1127012e-04, 3.5545565e-04, ..., 0.0000000e+00, 0.0000000e+00, 0.0000000e+00], [2.6624816e-04, 3.1270451e-04, 3.3004224e-04, ..., 0.0000000e+00, 0.0000000e+00, 0.0000000e+00], ... [0.0000000e+00, 0.0000000e+00, 0.0000000e+00, ..., 0.0000000e+00, 0.0000000e+00, 0.0000000e+00], [0.0000000e+00, 0.0000000e+00, 0.0000000e+00, ..., 0.0000000e+00, 0.0000000e+00, 0.0000000e+00], [0.0000000e+00, 0.0000000e+00, 0.0000000e+00, ..., 0.0000000e+00, 0.0000000e+00, 0.0000000e+00]], [[0.0000000e+00, 0.0000000e+00, 0.0000000e+00, ..., 0.0000000e+00, 0.0000000e+00, 0.0000000e+00], [0.0000000e+00, 0.0000000e+00, 0.0000000e+00, ..., 0.0000000e+00, 0.0000000e+00, 0.0000000e+00], [0.0000000e+00, 0.0000000e+00, 0.0000000e+00, ..., 0.0000000e+00, 0.0000000e+00, 0.0000000e+00], ..., [0.0000000e+00, 0.0000000e+00, 0.0000000e+00, ..., 0.0000000e+00, 0.0000000e+00, 0.0000000e+00], [0.0000000e+00, 0.0000000e+00, 0.0000000e+00, ..., 0.0000000e+00, 0.0000000e+00, 0.0000000e+00], [0.0000000e+00, 0.0000000e+00, 0.0000000e+00, ..., 0.0000000e+00, 0.0000000e+00, 0.0000000e+00]]]], dtype=float32) - WTT(time, z_w_top, nlat_t, nlon_t)float320.0 0.0 0.0 0.0 ... nan nan nan nan
- long_name :
- Heat Flux Across Top Face
- units :
- degC/s
- grid_loc :
- 3112
- cell_methods :
- time: mean
array([[[[ 0.0000000e+00, 0.0000000e+00, 0.0000000e+00, ..., nan, nan, nan], [ 0.0000000e+00, 0.0000000e+00, 0.0000000e+00, ..., nan, nan, nan], [ 0.0000000e+00, 0.0000000e+00, 0.0000000e+00, ..., nan, nan, nan], ..., [ 0.0000000e+00, 0.0000000e+00, 0.0000000e+00, ..., 0.0000000e+00, 0.0000000e+00, 0.0000000e+00], [ 0.0000000e+00, 0.0000000e+00, 0.0000000e+00, ..., 0.0000000e+00, 0.0000000e+00, 0.0000000e+00], [ 0.0000000e+00, 0.0000000e+00, 0.0000000e+00, ..., 0.0000000e+00, 0.0000000e+00, 0.0000000e+00]], [[-1.8136426e-06, 4.5334463e-07, 2.2615798e-06, ..., nan, nan, nan], [-1.9421007e-06, -5.4907474e-07, 2.2240058e-06, ..., nan, nan, nan], [-7.2046146e-07, 9.9928832e-07, 2.7894878e-06, ..., nan, nan, nan], ... nan, nan, nan], [ nan, nan, nan, ..., nan, nan, nan], [ nan, nan, nan, ..., nan, nan, nan]], [[ nan, nan, nan, ..., nan, nan, nan], [ nan, nan, nan, ..., nan, nan, nan], [ nan, nan, nan, ..., nan, nan, nan], ..., [ nan, nan, nan, ..., nan, nan, nan], [ nan, nan, nan, ..., nan, nan, nan], [ nan, nan, nan, ..., nan, nan, nan]]]], dtype=float32) - KPP_SRC_TEMP(time, z_t, nlat_t, nlon_t)float321.908e-06 1.893e-06 ... nan nan
- long_name :
- TEMP tendency from KPP non local mixing term
- units :
- degC/s
- grid_loc :
- 3111
- cell_methods :
- time: mean
array([[[[ 1.9081156e-06, 1.8931496e-06, 1.8960266e-06, ..., nan, nan, nan], [ 1.9311058e-06, 1.9211293e-06, 1.9011511e-06, ..., nan, nan, nan], [ 1.9428837e-06, 1.9275881e-06, 1.8980155e-06, ..., nan, nan, nan], ..., [ 3.3589786e-06, 3.3521228e-06, 3.3574988e-06, ..., 3.4062562e-06, 3.3715301e-06, 3.3560254e-06], [ 3.3741817e-06, 3.3580829e-06, 3.3415474e-06, ..., 3.2377363e-06, 3.2162511e-06, 3.2016746e-06], [ 3.4094669e-06, 3.3413685e-06, 3.3148640e-06, ..., 3.2443781e-06, 3.2285154e-06, 3.2340224e-06]], [[-8.3198194e-07, -9.2617216e-07, -1.0746325e-06, ..., nan, nan, nan], [-9.6195481e-07, -1.1010576e-06, -1.2223530e-06, ..., nan, nan, nan], [-1.1061006e-06, -1.2426525e-06, -1.3450500e-06, ..., nan, nan, nan], ... nan, nan, nan], [ nan, nan, nan, ..., nan, nan, nan], [ nan, nan, nan, ..., nan, nan, nan]], [[ nan, nan, nan, ..., nan, nan, nan], [ nan, nan, nan, ..., nan, nan, nan], [ nan, nan, nan, ..., nan, nan, nan], ..., [ nan, nan, nan, ..., nan, nan, nan], [ nan, nan, nan, ..., nan, nan, nan], [ nan, nan, nan, ..., nan, nan, nan]]]], dtype=float32) - UVEL(time, z_t, nlat_u, nlon_u)float32-23.85 -25.17 -25.21 ... nan nan
- long_name :
- Velocity in grid-x direction
- units :
- centimeter/s
- grid_loc :
- 3221
- cell_methods :
- time: mean
array([[[[-23.847055 , -25.16644 , -25.207188 , ..., nan, nan, nan], [-23.674194 , -24.12648 , -23.336342 , ..., nan, nan, nan], [-22.778587 , -22.259188 , -20.696669 , ..., nan, nan, nan], ..., [-16.224794 , -16.356735 , -16.52335 , ..., -24.132261 , -21.900045 , -19.957563 ], [-15.722776 , -15.823919 , -15.971273 , ..., -21.053026 , -18.39876 , -16.18444 ], [-15.349255 , -15.505581 , -15.668845 , ..., -14.479387 , -11.345076 , -8.803285 ]], [[-19.238626 , -20.463634 , -20.428509 , ..., nan, nan, nan], [-19.051489 , -19.41288 , -18.551231 , ..., nan, nan, nan], [-18.12522 , -17.527023 , -15.908432 , ..., nan, nan, nan], ... [ nan, nan, nan, ..., nan, nan, nan], [ nan, nan, nan, ..., nan, nan, nan], [ nan, nan, nan, ..., nan, nan, nan]], [[ nan, nan, nan, ..., nan, nan, nan], [ nan, nan, nan, ..., nan, nan, nan], [ nan, nan, nan, ..., nan, nan, nan], ..., [ nan, nan, nan, ..., nan, nan, nan], [ nan, nan, nan, ..., nan, nan, nan], [ nan, nan, nan, ..., nan, nan, nan]]]], dtype=float32) - VVEL(time, z_t, nlat_u, nlon_u)float3210.3 13.78 15.95 ... nan nan nan
- long_name :
- Velocity in grid-y direction
- units :
- centimeter/s
- grid_loc :
- 3221
- cell_methods :
- time: mean
array([[[[10.3000965 , 13.77956 , 15.953891 , ..., nan, nan, nan], [11.688542 , 14.112952 , 15.041122 , ..., nan, nan, nan], [12.2102375 , 13.598565 , 13.419611 , ..., nan, nan, nan], ..., [ 8.0788145 , 7.964908 , 7.7867136 , ..., 5.961892 , 4.1783137 , 2.8519673 ], [ 8.20122 , 8.068523 , 7.8838167 , ..., 2.920298 , 1.6612542 , 0.8307241 ], [ 8.376501 , 8.167209 , 7.94016 , ..., 1.1996826 , 0.6480607 , 0.56002045]], [[ 9.770115 , 13.304171 , 15.574204 , ..., nan, nan, nan], [11.196156 , 13.686066 , 14.714426 , ..., nan, nan, nan], [11.761392 , 13.2268715 , 13.136265 , ..., nan, nan, nan], ... [ nan, nan, nan, ..., nan, nan, nan], [ nan, nan, nan, ..., nan, nan, nan], [ nan, nan, nan, ..., nan, nan, nan]], [[ nan, nan, nan, ..., nan, nan, nan], [ nan, nan, nan, ..., nan, nan, nan], [ nan, nan, nan, ..., nan, nan, nan], ..., [ nan, nan, nan, ..., nan, nan, nan], [ nan, nan, nan, ..., nan, nan, nan], [ nan, nan, nan, ..., nan, nan, nan]]]], dtype=float32) - WVEL(time, z_w_top, nlat_t, nlon_t)float32-1.145e-06 -1.913e-06 ... nan nan
- long_name :
- Vertical Velocity
- units :
- centimeter/s
- grid_loc :
- 3112
- cell_methods :
- time: mean
array([[[[-1.14457885e-06, -1.91288495e-06, -2.71676004e-06, ..., nan, nan, nan], [-2.08003507e-06, -2.85347369e-06, -3.32594004e-06, ..., nan, nan, nan], [-3.11472149e-06, -3.70206385e-06, -4.09347331e-06, ..., nan, nan, nan], ..., [-3.18068118e-07, -6.31587227e-07, -9.76381443e-07, ..., -8.56450788e-06, -8.88406885e-06, -9.19648483e-06], [ 1.82996402e-07, -1.23177255e-08, -4.03085352e-07, ..., -9.88163902e-06, -1.02769427e-05, -1.05121744e-05], [ 8.15758483e-07, 5.05344588e-07, 2.10113157e-07, ..., -1.10888705e-05, -1.14121858e-05, -1.17109212e-05]], [[-6.78560173e-05, 1.65317997e-05, 8.41080400e-05, ..., nan, nan, nan], [-7.26168801e-05, -2.09417321e-05, 8.21649664e-05, ..., nan, nan, nan], [-2.72717698e-05, 3.63916042e-05, 1.02940867e-04, ..., nan, nan, nan], ... nan, nan, nan], [ nan, nan, nan, ..., nan, nan, nan], [ nan, nan, nan, ..., nan, nan, nan]], [[ nan, nan, nan, ..., nan, nan, nan], [ nan, nan, nan, ..., nan, nan, nan], [ nan, nan, nan, ..., nan, nan, nan], ..., [ nan, nan, nan, ..., nan, nan, nan], [ nan, nan, nan, ..., nan, nan, nan], [ nan, nan, nan, ..., nan, nan, nan]]]], dtype=float32) - TEMP(time, z_t, nlat_t, nlon_t)float3226.87 26.86 26.87 ... nan nan nan
- long_name :
- Potential Temperature
- units :
- degC
- grid_loc :
- 3111
- cell_methods :
- time: mean
array([[[[26.87082 , 26.860653 , 26.87325 , ..., nan, nan, nan], [26.892637 , 26.88897 , 26.904346 , ..., nan, nan, nan], [26.914022 , 26.91649 , 26.931889 , ..., nan, nan, nan], ..., [27.944225 , 27.942217 , 27.93959 , ..., 27.890944 , 27.878847 , 27.86957 ], [27.937271 , 27.932907 , 27.924606 , ..., 27.788717 , 27.77791 , 27.773256 ], [27.93139 , 27.924898 , 27.912024 , ..., 27.733301 , 27.728266 , 27.725992 ]], [[26.843391 , 26.830946 , 26.840658 , ..., nan, nan, nan], [26.86406 , 26.858273 , 26.871187 , ..., nan, nan, nan], [26.88372 , 26.88491 , 26.898113 , ..., nan, nan, nan], ... [ nan, nan, nan, ..., nan, nan, nan], [ nan, nan, nan, ..., nan, nan, nan], [ nan, nan, nan, ..., nan, nan, nan]], [[ nan, nan, nan, ..., nan, nan, nan], [ nan, nan, nan, ..., nan, nan, nan], [ nan, nan, nan, ..., nan, nan, nan], ..., [ nan, nan, nan, ..., nan, nan, nan], [ nan, nan, nan, ..., nan, nan, nan], [ nan, nan, nan, ..., nan, nan, nan]]]], dtype=float32) - DXT(nlat_t, nlon_t)float641.074e+06 1.074e+06 ... 1.074e+06
- long_name :
- x-spacing centered at T points
- units :
- centimeters
- grid_loc :
- 2110
array([[1073515.23592822, 1073515.23592822, 1073515.23592822, ..., 1073515.23592822, 1073515.23592836, 1073515.23592822], [1074001.22366965, 1074001.22366965, 1074001.22366965, ..., 1074001.22366965, 1074001.22366978, 1074001.22366965], [1074484.37491886, 1074484.37491886, 1074484.37491886, ..., 1074484.37491886, 1074484.374919 , 1074484.37491886], ..., [1074964.67403232, 1074964.67403232, 1074964.67403232, ..., 1074964.67403232, 1074964.67403232, 1074964.67403232], [1074484.36592709, 1074484.36592709, 1074484.36592709, ..., 1074484.36592709, 1074484.36592709, 1074484.36592709], [1074001.21457761, 1074001.21457761, 1074001.21457761, ..., 1074001.21457761, 1074001.21457761, 1074001.21457761]]) - DXU(nlat_u, nlon_u)float641.074e+06 1.074e+06 ... 1.074e+06
- long_name :
- x-spacing centered at U points
- units :
- centimeters
- grid_loc :
- 2220
array([[1073758.93807444, 1073758.93807444, 1073758.93807457, ..., 1073758.9380745 , 1073758.9380745 , 1073758.9380745 ], [1074243.50926486, 1074243.50926486, 1074243.50926499, ..., 1074243.50926493, 1074243.50926493, 1074243.50926493], [1074725.24057286, 1074725.24057286, 1074725.240573 , ..., 1074725.24057293, 1074725.24057293, 1074725.24057293], ..., [1074725.23162819, 1074725.23162819, 1074725.23162819, ..., 1074725.23162819, 1074725.23162819, 1074725.23162819], [1074243.50022599, 1074243.50022599, 1074243.50022599, ..., 1074243.50022599, 1074243.50022599, 1074243.50022599], [1073758.92892923, 1073758.92892923, 1073758.92892923, ..., 1073758.92892923, 1073758.92892923, 1073758.92892923]]) - DYT(nlat_t, nlon_t)float641.074e+06 1.074e+06 ... 1.074e+06
- long_name :
- y-spacing centered at T points
- units :
- centimeters
- grid_loc :
- 2110
array([[1073758.93807452, 1073758.93807452, 1073758.93807452, ..., 1073758.93807452, 1073758.93807452, 1073758.93807452], [1074243.50926492, 1074243.50926492, 1074243.50926492, ..., 1074243.50926492, 1074243.50926492, 1074243.50926492], [1074725.24057292, 1074725.24057292, 1074725.24057292, ..., 1074725.24057292, 1074725.24057292, 1074725.24057292], ..., [1075204.12523512, 1075204.12523512, 1075204.12523512, ..., 1075204.12523512, 1075204.12523512, 1075204.12523512], [1074725.24055655, 1074725.24055655, 1074725.24055655, ..., 1074725.24055655, 1074725.24055655, 1074725.24055655], [1074243.50928416, 1074243.50928416, 1074243.50928416, ..., 1074243.50928416, 1074243.50928416, 1074243.50928416]]) - DYU(nlat_u, nlon_u)float641.074e+06 1.074e+06 ... 1.074e+06
- long_name :
- y-spacing centered at U points
- units :
- centimeters
- grid_loc :
- 2220
array([[1074001.22366972, 1074001.22366972, 1074001.22366972, ..., 1074001.22366972, 1074001.22366972, 1074001.22366972], [1074484.37491892, 1074484.37491892, 1074484.37491892, ..., 1074484.37491892, 1074484.37491892, 1074484.37491892], [1074964.68291175, 1074964.68291175, 1074964.68291175, ..., 1074964.68291175, 1074964.68291175, 1074964.68291175], ..., [1074964.68289583, 1074964.68289583, 1074964.68289583, ..., 1074964.68289583, 1074964.68289583, 1074964.68289583], [1074484.37492035, 1074484.37492035, 1074484.37492035, ..., 1074484.37492035, 1074484.37492035, 1074484.37492035], [1074001.22367978, 1074001.22367978, 1074001.22367978, ..., 1074001.22367978, 1074001.22367978, 1074001.22367978]]) - TAREA(nlat_t, nlon_t)float641.153e+12 1.153e+12 ... 1.154e+12
- long_name :
- area of T cells
- units :
- centimeter^2
- grid_loc :
- 2110
array([[1.15269658e+12, 1.15269658e+12, 1.15269658e+12, ..., 1.15269658e+12, 1.15269658e+12, 1.15269658e+12], [1.15373884e+12, 1.15373884e+12, 1.15373884e+12, ..., 1.15373884e+12, 1.15373884e+12, 1.15373884e+12], [1.15477548e+12, 1.15477548e+12, 1.15477548e+12, ..., 1.15477548e+12, 1.15477548e+12, 1.15477548e+12], ..., [1.15580645e+12, 1.15580645e+12, 1.15580645e+12, ..., 1.15580645e+12, 1.15580645e+12, 1.15580645e+12], [1.15477547e+12, 1.15477547e+12, 1.15477547e+12, ..., 1.15477547e+12, 1.15477547e+12, 1.15477547e+12], [1.15373883e+12, 1.15373883e+12, 1.15373883e+12, ..., 1.15373883e+12, 1.15373883e+12, 1.15373883e+12]]) - UAREA(nlat_u, nlon_u)float641.153e+12 1.153e+12 ... 1.153e+12
- long_name :
- area of U cells
- units :
- centimeter^2
- grid_loc :
- 2220
array([[1.15321841e+12, 1.15321841e+12, 1.15321841e+12, ..., 1.15321841e+12, 1.15321841e+12, 1.15321841e+12], [1.15425787e+12, 1.15425787e+12, 1.15425787e+12, ..., 1.15425787e+12, 1.15425787e+12, 1.15425787e+12], [1.15529168e+12, 1.15529168e+12, 1.15529168e+12, ..., 1.15529168e+12, 1.15529168e+12, 1.15529168e+12], ..., [1.15529167e+12, 1.15529167e+12, 1.15529167e+12, ..., 1.15529167e+12, 1.15529167e+12, 1.15529167e+12], [1.15425786e+12, 1.15425786e+12, 1.15425786e+12, ..., 1.15425786e+12, 1.15425786e+12, 1.15425786e+12], [1.15321840e+12, 1.15321840e+12, 1.15321840e+12, ..., 1.15321840e+12, 1.15321840e+12, 1.15321840e+12]]) - QSW_3D(time, z_w_top, nlat_t, nlon_t)float32245.0 245.2 245.5 ... nan nan nan
- long_name :
- Solar Short-Wave Heat Flux
- units :
- watt/m^2
- grid_loc :
- 3112
- cell_methods :
- time: mean
array([[[[2.4503796e+02, 2.4521341e+02, 2.4545235e+02, ..., nan, nan, nan], [2.4492380e+02, 2.4512425e+02, 2.4535846e+02, ..., nan, nan, nan], [2.4538518e+02, 2.4562317e+02, 2.4585333e+02, ..., nan, nan, nan], ..., [2.1068733e+02, 2.1091066e+02, 2.1109772e+02, ..., 2.0814592e+02, 2.0798094e+02, 2.0769438e+02], [2.0984216e+02, 2.0997974e+02, 2.1009404e+02, ..., 2.0629115e+02, 2.0618259e+02, 2.0596118e+02], [2.0890120e+02, 2.0894778e+02, 2.0897307e+02, ..., 2.0409979e+02, 2.0402664e+02, 2.0386365e+02]], [[7.4346901e+01, 7.4893471e+01, 7.4966232e+01, ..., nan, nan, nan], [7.4140999e+01, 7.5024002e+01, 7.4937622e+01, ..., nan, nan, nan], [7.3926872e+01, 7.5331734e+01, 7.5553886e+01, ..., nan, nan, nan], ... [ nan, nan, nan, ..., nan, nan, nan], [ nan, nan, nan, ..., nan, nan, nan], [ nan, nan, nan, ..., nan, nan, nan]], [[ nan, nan, nan, ..., nan, nan, nan], [ nan, nan, nan, ..., nan, nan, nan], [ nan, nan, nan, ..., nan, nan, nan], ..., [ nan, nan, nan, ..., nan, nan, nan], [ nan, nan, nan, ..., nan, nan, nan], [ nan, nan, nan, ..., nan, nan, nan]]]], dtype=float32) - HDIFE_TEMP(time, z_t, nlat_t, nlon_u)float32-2.614e-09 3.977e-10 ... 0.0 0.0
- long_name :
- TEMP Horizontal Diffusive Flux in grid-x direction
- units :
- degC/s
- grid_loc :
- 3211
- cell_methods :
- time: mean
array([[[[-2.61363331e-09, 3.97678473e-10, 5.53805890e-09, ..., 0.00000000e+00, 0.00000000e+00, 0.00000000e+00], [-2.02023864e-09, 4.69246086e-10, 3.53268170e-09, ..., 0.00000000e+00, 0.00000000e+00, 0.00000000e+00], [-6.58720467e-10, 3.35899447e-10, 4.35073089e-09, ..., 0.00000000e+00, 0.00000000e+00, 0.00000000e+00], ..., [ 7.77489517e-10, 5.60605951e-10, 1.05229159e-09, ..., -3.79286513e-09, -2.29235653e-09, -1.63621450e-09], [-1.17345147e-10, -7.85200405e-10, -2.93594093e-10, ..., -1.56652413e-09, 9.83300774e-10, 1.27887168e-09], [-1.61476321e-09, -1.67141367e-09, -1.29242805e-09, ..., -7.67886657e-11, 3.05740378e-13, -1.06822218e-09]], [[-2.69555733e-09, -1.73000336e-10, 5.53882273e-09, ..., 0.00000000e+00, 0.00000000e+00, 0.00000000e+00], [-2.20887775e-09, 2.73736506e-10, 3.42142537e-09, ..., 0.00000000e+00, 0.00000000e+00, 0.00000000e+00], [-1.14210606e-10, -2.05884476e-10, 4.37129932e-09, ..., 0.00000000e+00, 0.00000000e+00, 0.00000000e+00], ... 0.00000000e+00, 0.00000000e+00, 0.00000000e+00], [ 0.00000000e+00, 0.00000000e+00, 0.00000000e+00, ..., 0.00000000e+00, 0.00000000e+00, 0.00000000e+00], [ 0.00000000e+00, 0.00000000e+00, 0.00000000e+00, ..., 0.00000000e+00, 0.00000000e+00, 0.00000000e+00]], [[ 0.00000000e+00, 0.00000000e+00, 0.00000000e+00, ..., 0.00000000e+00, 0.00000000e+00, 0.00000000e+00], [ 0.00000000e+00, 0.00000000e+00, 0.00000000e+00, ..., 0.00000000e+00, 0.00000000e+00, 0.00000000e+00], [ 0.00000000e+00, 0.00000000e+00, 0.00000000e+00, ..., 0.00000000e+00, 0.00000000e+00, 0.00000000e+00], ..., [ 0.00000000e+00, 0.00000000e+00, 0.00000000e+00, ..., 0.00000000e+00, 0.00000000e+00, 0.00000000e+00], [ 0.00000000e+00, 0.00000000e+00, 0.00000000e+00, ..., 0.00000000e+00, 0.00000000e+00, 0.00000000e+00], [ 0.00000000e+00, 0.00000000e+00, 0.00000000e+00, ..., 0.00000000e+00, 0.00000000e+00, 0.00000000e+00]]]], dtype=float32) - HDIFN_TEMP(time, z_t, nlat_u, nlon_t)float321.523e-09 2.115e-09 ... 0.0 0.0
- long_name :
- TEMP Horizontal Diffusive Flux in grid-y direction
- units :
- degC/s
- grid_loc :
- 3121
- cell_methods :
- time: mean
array([[[[ 1.5234107e-09, 2.1147035e-09, 2.1866646e-09, ..., 0.0000000e+00, 0.0000000e+00, 0.0000000e+00], [ 1.0528922e-09, 2.4132025e-09, 2.2802233e-09, ..., 0.0000000e+00, 0.0000000e+00, 0.0000000e+00], [ 1.0610099e-09, 8.2111201e-10, 3.3776854e-10, ..., 0.0000000e+00, 0.0000000e+00, 0.0000000e+00], ..., [ 6.5940325e-10, -2.3492633e-10, -1.5794358e-09, ..., -2.2142579e-08, -1.9915809e-08, -1.6642490e-08], [ 9.3933317e-10, -5.5595600e-10, -1.4402700e-09, ..., -1.8002760e-09, -3.1114103e-10, -1.2936970e-09], [ 3.5679815e-10, 1.4825304e-09, 1.1625649e-09, ..., 1.9614790e-08, 2.2439606e-08, 2.3393657e-08]], [[ 1.4882273e-09, 1.9726851e-09, 2.4194657e-09, ..., 0.0000000e+00, 0.0000000e+00, 0.0000000e+00], [ 4.5186824e-10, 2.5454869e-09, 2.0658932e-09, ..., 0.0000000e+00, 0.0000000e+00, 0.0000000e+00], [ 1.0766217e-09, 4.0454967e-10, 2.9939556e-10, ..., 0.0000000e+00, 0.0000000e+00, 0.0000000e+00], ... 0.0000000e+00, 0.0000000e+00, 0.0000000e+00], [ 0.0000000e+00, 0.0000000e+00, 0.0000000e+00, ..., 0.0000000e+00, 0.0000000e+00, 0.0000000e+00], [ 0.0000000e+00, 0.0000000e+00, 0.0000000e+00, ..., 0.0000000e+00, 0.0000000e+00, 0.0000000e+00]], [[ 0.0000000e+00, 0.0000000e+00, 0.0000000e+00, ..., 0.0000000e+00, 0.0000000e+00, 0.0000000e+00], [ 0.0000000e+00, 0.0000000e+00, 0.0000000e+00, ..., 0.0000000e+00, 0.0000000e+00, 0.0000000e+00], [ 0.0000000e+00, 0.0000000e+00, 0.0000000e+00, ..., 0.0000000e+00, 0.0000000e+00, 0.0000000e+00], ..., [ 0.0000000e+00, 0.0000000e+00, 0.0000000e+00, ..., 0.0000000e+00, 0.0000000e+00, 0.0000000e+00], [ 0.0000000e+00, 0.0000000e+00, 0.0000000e+00, ..., 0.0000000e+00, 0.0000000e+00, 0.0000000e+00], [ 0.0000000e+00, 0.0000000e+00, 0.0000000e+00, ..., 0.0000000e+00, 0.0000000e+00, 0.0000000e+00]]]], dtype=float32) - dz(z_t)float321e+03 1e+03 ... 2.5e+04 2.5e+04
- long_name :
- thickness of layer k
- units :
- centimeters
array([ 1000. , 1000. , 1000. , 1000. , 1000. , 1000. , 1000. , 1000. , 1000. , 1000. , 1000. , 1000. , 1000. , 1000. , 1000. , 1000. , 1019.6808, 1056.4484, 1105.9951, 1167.807 , 1242.4133, 1330.9678, 1435.141 , 1557.1259, 1699.6796, 1866.2124, 2060.9023, 2288.852 , 2556.247 , 2870.575 , 3240.8372, 3677.7725, 4194.031 , 4804.2236, 5524.7544, 6373.192 , 7366.945 , 8520.893 , 9843.658 , 11332.466 , 12967.199 , 14705.344 , 16480.709 , 18209.135 , 19802.234 , 21185.957 , 22316.51 , 23186.494 , 23819.45 , 24257.217 , 24546.78 , 24731.014 , 24844.328 , 24911.975 , 24951.291 , 24973.594 , 24985.96 , 24992.674 , 24996.244 , 24998.11 , 25000. , 25000. ], dtype=float32) - dzw(z_w_top)float32500.0 1e+03 ... 2.5e+04 2.5e+04
- long_name :
- midpoint of k to midpoint of k+1
- units :
- centimeters
array([ 500. , 1000. , 1000. , 1000. , 1000. , 1000. , 1000. , 1000. , 1000. , 1000. , 1000. , 1000. , 1000. , 1000. , 1000. , 1000. , 1009.8404, 1038.0646, 1081.2218, 1136.901 , 1205.1101, 1286.6906, 1383.0544, 1496.1334, 1628.4027, 1782.946 , 1963.5574, 2174.8772, 2422.5496, 2713.4111, 3055.706 , 3459.305 , 3935.9016, 4499.1274, 5164.489 , 5948.973 , 6870.0684, 7943.9185, 9182.275 , 10588.062 , 12149.832 , 13836.271 , 15593.026 , 17344.922 , 19005.686 , 20494.096 , 21751.234 , 22751.502 , 23502.97 , 24038.332 , 24401.998 , 24638.896 , 24787.672 , 24878.15 , 24931.633 , 24962.443 , 24979.777 , 24989.316 , 24994.459 , 24997.176 , 24999.055 , 25000. ], dtype=float32) - hflux_factor()float642.439e-05
- long_name :
- Convert Heat and Solar Flux to Temperature Flux
array(2.439086e-05)
- KMT(nlat_t, nlon_t)float6454.0 54.0 51.0 ... 55.0 55.0 55.0
- long_name :
- k Index of Deepest Grid Cell on T Grid
- grid_loc :
- 2110
array([[54., 54., 51., ..., 0., 0., 0.], [54., 54., 51., ..., 0., 0., 0.], [53., 53., 53., ..., 0., 0., 0.], ..., [60., 59., 58., ..., 55., 55., 55.], [60., 60., 58., ..., 55., 55., 55.], [60., 60., 57., ..., 55., 55., 55.]]) - KMU(nlat_u, nlon_u)float6454.0 51.0 50.0 ... 55.0 55.0 54.0
- long_name :
- k Index of Deepest Grid Cell on U Grid
- grid_loc :
- 2220
array([[54., 51., 50., ..., 0., 0., 0.], [53., 51., 50., ..., 0., 0., 0.], [51., 53., 50., ..., 0., 0., 0.], ..., [59., 58., 53., ..., 55., 55., 55.], [60., 57., 51., ..., 55., 55., 55.], [60., 57., 51., ..., 55., 55., 54.]]) - DIA_IMPVF_TEMP(time, z_w_bot, nlat_t, nlon_t)float320.002014 0.002064 ... nan nan
- long_name :
- TEMP Flux Across Bottom Face from Diabatic Implicit Vertical Mixing
- units :
- degC cm/s
- grid_loc :
- 3113
- cell_methods :
- time: mean
array([[[[ 0.00201446, 0.00206392, 0.00216143, ..., nan, nan, nan], [ 0.00207787, 0.00209014, 0.0020967 , ..., nan, nan, nan], [ 0.00211517, 0.00207939, 0.00206672, ..., nan, nan, nan], ..., [-0.00047228, -0.000478 , -0.00047246, ..., 0.00089965, 0.00086071, 0.00085359], [-0.00048336, -0.00052305, -0.00054949, ..., 0.00081171, 0.00079006, 0.00077401], [-0.00050689, -0.00061991, -0.00065286, ..., 0.00081445, 0.00080362, 0.00079664]], [[ 0.00156129, 0.00148329, 0.00143757, ..., nan, nan, nan], [ 0.00149684, 0.00133019, 0.00116567, ..., nan, nan, nan], [ 0.00137402, 0.00115166, 0.00100973, ..., nan, nan, nan], ... [ nan, nan, nan, ..., nan, nan, nan], [ nan, nan, nan, ..., nan, nan, nan], [ nan, nan, nan, ..., nan, nan, nan]], [[ nan, nan, nan, ..., nan, nan, nan], [ nan, nan, nan, ..., nan, nan, nan], [ nan, nan, nan, ..., nan, nan, nan], ..., [ nan, nan, nan, ..., nan, nan, nan], [ nan, nan, nan, ..., nan, nan, nan], [ nan, nan, nan, ..., nan, nan, nan]]]], dtype=float32) - SHF(time, nlat_t, nlon_t)float3294.64 96.18 96.52 ... -58.45 -58.65
- long_name :
- Total Surface Heat Flux, Including SW
- units :
- watt/m^2
- grid_loc :
- 2110
- cell_methods :
- time: mean
array([[[ 94.63771 , 96.180855, 96.5201 , ..., nan, nan, nan], [ 94.54357 , 95.62748 , 95.657 , ..., nan, nan, nan], [ 94.91275 , 95.54686 , 95.41937 , ..., nan, nan, nan], ..., [-110.82676 , -110.83065 , -110.76642 , ..., -61.922012, -61.4474 , -61.26228 ], [-112.51893 , -112.39957 , -111.94688 , ..., -58.07367 , -57.64793 , -57.7017 ], [-114.27047 , -114.06644 , -113.31602 , ..., -58.45006 , -58.448246, -58.651115]]], dtype=float32) - SHF_QSW(time, nlat_t, nlon_t)float32245.0 245.2 245.5 ... 204.0 203.9
- long_name :
- Solar Short-Wave Heat Flux
- units :
- watt/m^2
- grid_loc :
- 2110
- cell_methods :
- time: mean
array([[[245.03796, 245.21341, 245.45235, ..., nan, nan, nan], [244.9238 , 245.12425, 245.35846, ..., nan, nan, nan], [245.38518, 245.62317, 245.85333, ..., nan, nan, nan], ..., [210.68733, 210.91066, 211.09772, ..., 208.14592, 207.98094, 207.69438], [209.84216, 209.97974, 210.09404, ..., 206.29115, 206.18259, 205.96118], [208.9012 , 208.94778, 208.97307, ..., 204.0998 , 204.02664, 203.86365]]], dtype=float32) - DZT(z_t, nlat_t, nlon_t)float321e+03 1e+03 ... 2.5e+04 2.5e+04
- longname :
- T-grid cell thickness
- units :
- cm
- grid_loc :
- 3111
array([[[ 1000. , 1000. , 1000. , ..., 1000. , 1000. , 1000. ], [ 1000. , 1000. , 1000. , ..., 1000. , 1000. , 1000. ], [ 1000. , 1000. , 1000. , ..., 1000. , 1000. , 1000. ], ..., [ 1000. , 1000. , 1000. , ..., 1000. , 1000. , 1000. ], [ 1000. , 1000. , 1000. , ..., 1000. , 1000. , 1000. ], [ 1000. , 1000. , 1000. , ..., 1000. , 1000. , 1000. ]], [[ 1000. , 1000. , 1000. , ..., 1000. , 1000. , 1000. ], [ 1000. , 1000. , 1000. , ..., 1000. , 1000. , 1000. ], [ 1000. , 1000. , 1000. , ..., 1000. , 1000. , 1000. ], ... [25000. , 25000. , 25000. , ..., 25000. , 25000. , 25000. ], [25000. , 25000. , 25000. , ..., 25000. , 25000. , 25000. ], [25000. , 25000. , 25000. , ..., 25000. , 25000. , 25000. ]], [[25000. , 25000. , 25000. , ..., 25000. , 25000. , 25000. ], [25000. , 25000. , 25000. , ..., 25000. , 25000. , 25000. ], [25000. , 25000. , 25000. , ..., 25000. , 25000. , 25000. ], ..., [25000. , 25000. , 25000. , ..., 25000. , 25000. , 25000. ], [25000. , 25000. , 25000. , ..., 25000. , 25000. , 25000. ], [25000. , 25000. , 25000. , ..., 25000. , 25000. , 25000. ]]], dtype=float32) - DZU(z_t, nlat_u, nlon_u)float321e+03 1e+03 ... 2.5e+04 2.5e+04
- longname :
- U-grid cell thickness
- units :
- cm
- grid_loc :
- 3221
array([[[ 1000. , 1000. , 1000. , ..., 1000. , 1000. , 1000. ], [ 1000. , 1000. , 1000. , ..., 1000. , 1000. , 1000. ], [ 1000. , 1000. , 1000. , ..., 1000. , 1000. , 1000. ], ..., [ 1000. , 1000. , 1000. , ..., 1000. , 1000. , 1000. ], [ 1000. , 1000. , 1000. , ..., 1000. , 1000. , 1000. ], [ 1000. , 1000. , 1000. , ..., 1000. , 1000. , 1000. ]], [[ 1000. , 1000. , 1000. , ..., 1000. , 1000. , 1000. ], [ 1000. , 1000. , 1000. , ..., 1000. , 1000. , 1000. ], [ 1000. , 1000. , 1000. , ..., 1000. , 1000. , 1000. ], ... [25000. , 25000. , 25000. , ..., 25000. , 25000. , 25000. ], [25000. , 25000. , 25000. , ..., 25000. , 25000. , 25000. ], [25000. , 25000. , 25000. , ..., 25000. , 25000. , 25000. ]], [[25000. , 25000. , 25000. , ..., 25000. , 25000. , 25000. ], [25000. , 25000. , 25000. , ..., 25000. , 25000. , 25000. ], [25000. , 25000. , 25000. , ..., 25000. , 25000. , 25000. ], ..., [25000. , 25000. , 25000. , ..., 25000. , 25000. , 25000. ], [25000. , 25000. , 25000. , ..., 25000. , 25000. , 25000. ], [25000. , 25000. , 25000. , ..., 25000. , 25000. , 25000. ]]], dtype=float32) - cell_volume_t(z_t, nlat, nlon)float641.153e+15 1.153e+15 ... 2.884e+16
array([[[1.15269658e+15, 1.15269658e+15, 1.15269658e+15, ..., 1.15269658e+15, 1.15269658e+15, 1.15269658e+15], [1.15373884e+15, 1.15373884e+15, 1.15373884e+15, ..., 1.15373884e+15, 1.15373884e+15, 1.15373884e+15], [1.15477548e+15, 1.15477548e+15, 1.15477548e+15, ..., 1.15477548e+15, 1.15477548e+15, 1.15477548e+15], ..., [1.15580645e+15, 1.15580645e+15, 1.15580645e+15, ..., 1.15580645e+15, 1.15580645e+15, 1.15580645e+15], [1.15477547e+15, 1.15477547e+15, 1.15477547e+15, ..., 1.15477547e+15, 1.15477547e+15, 1.15477547e+15], [1.15373883e+15, 1.15373883e+15, 1.15373883e+15, ..., 1.15373883e+15, 1.15373883e+15, 1.15373883e+15]], [[1.15269658e+15, 1.15269658e+15, 1.15269658e+15, ..., 1.15269658e+15, 1.15269658e+15, 1.15269658e+15], [1.15373884e+15, 1.15373884e+15, 1.15373884e+15, ..., 1.15373884e+15, 1.15373884e+15, 1.15373884e+15], [1.15477548e+15, 1.15477548e+15, 1.15477548e+15, ..., 1.15477548e+15, 1.15477548e+15, 1.15477548e+15], ... [2.88951613e+16, 2.88951613e+16, 2.88951613e+16, ..., 2.88951613e+16, 2.88951613e+16, 2.88951613e+16], [2.88693867e+16, 2.88693867e+16, 2.88693867e+16, ..., 2.88693867e+16, 2.88693867e+16, 2.88693867e+16], [2.88434708e+16, 2.88434708e+16, 2.88434708e+16, ..., 2.88434708e+16, 2.88434708e+16, 2.88434708e+16]], [[2.88174145e+16, 2.88174145e+16, 2.88174145e+16, ..., 2.88174145e+16, 2.88174145e+16, 2.88174145e+16], [2.88434711e+16, 2.88434711e+16, 2.88434711e+16, ..., 2.88434711e+16, 2.88434711e+16, 2.88434711e+16], [2.88693870e+16, 2.88693870e+16, 2.88693870e+16, ..., 2.88693870e+16, 2.88693870e+16, 2.88693870e+16], ..., [2.88951613e+16, 2.88951613e+16, 2.88951613e+16, ..., 2.88951613e+16, 2.88951613e+16, 2.88951613e+16], [2.88693867e+16, 2.88693867e+16, 2.88693867e+16, ..., 2.88693867e+16, 2.88693867e+16, 2.88693867e+16], [2.88434708e+16, 2.88434708e+16, 2.88434708e+16, ..., 2.88434708e+16, 2.88434708e+16, 2.88434708e+16]]]) - cell_volume_u(z_t, nlat, nlon)float641.153e+15 1.153e+15 ... 2.884e+16
array([[[1.15269658e+15, 1.15269658e+15, 1.15269658e+15, ...,
         1.15269658e+15, 1.15269658e+15, 1.15269658e+15],
        [1.15373884e+15, 1.15373884e+15, 1.15373884e+15, ...,
         1.15373884e+15, 1.15373884e+15, 1.15373884e+15],
        [1.15477548e+15, 1.15477548e+15, 1.15477548e+15, ...,
         1.15477548e+15, 1.15477548e+15, 1.15477548e+15],
        ...,
        [1.15580645e+15, 1.15580645e+15, 1.15580645e+15, ...,
         1.15580645e+15, 1.15580645e+15, 1.15580645e+15],
        [1.15477547e+15, 1.15477547e+15, 1.15477547e+15, ...,
         1.15477547e+15, 1.15477547e+15, 1.15477547e+15],
        [1.15373883e+15, 1.15373883e+15, 1.15373883e+15, ...,
         1.15373883e+15, 1.15373883e+15, 1.15373883e+15]],

       [[1.15269658e+15, 1.15269658e+15, 1.15269658e+15, ...,
         1.15269658e+15, 1.15269658e+15, 1.15269658e+15],
        [1.15373884e+15, 1.15373884e+15, 1.15373884e+15, ...,
         1.15373884e+15, 1.15373884e+15, 1.15373884e+15],
        [1.15477548e+15, 1.15477548e+15, 1.15477548e+15, ...,
         1.15477548e+15, 1.15477548e+15, 1.15477548e+15],
...
        [2.88951613e+16, 2.88951613e+16, 2.88951613e+16, ...,
         2.88951613e+16, 2.88951613e+16, 2.88951613e+16],
        [2.88693867e+16, 2.88693867e+16, 2.88693867e+16, ...,
         2.88693867e+16, 2.88693867e+16, 2.88693867e+16],
        [2.88434708e+16, 2.88434708e+16, 2.88434708e+16, ...,
         2.88434708e+16, 2.88434708e+16, 2.88434708e+16]],

       [[2.88174145e+16, 2.88174145e+16, 2.88174145e+16, ...,
         2.88174145e+16, 2.88174145e+16, 2.88174145e+16],
        [2.88434711e+16, 2.88434711e+16, 2.88434711e+16, ...,
         2.88434711e+16, 2.88434711e+16, 2.88434711e+16],
        [2.88693870e+16, 2.88693870e+16, 2.88693870e+16, ...,
         2.88693870e+16, 2.88693870e+16, 2.88693870e+16],
        ...,
        [2.88951613e+16, 2.88951613e+16, 2.88951613e+16, ...,
         2.88951613e+16, 2.88951613e+16, 2.88951613e+16],
        [2.88693867e+16, 2.88693867e+16, 2.88693867e+16, ...,
         2.88693867e+16, 2.88693867e+16, 2.88693867e+16],
        [2.88434708e+16, 2.88434708e+16, 2.88434708e+16, ...,
         2.88434708e+16, 2.88434708e+16, 2.88434708e+16]]])
- title :
- g.e20.G.TL319_t13.control.001_hfreq
- history :
- none
- Conventions :
- CF-1.0; http://www.cgd.ucar.edu/cms/eaton/netcdf/CF-current.htm
- time_period_freq :
- day_5
- model_doi_url :
- https://doi.org/10.5065/D67H1H0V
- contents :
- Diagnostic and Prognostic Variables
- source :
- CCSM POP2, the CCSM Ocean Component
- revision :
- $Id: tavg.F90 89091 2018-04-30 15:58:32Z altuntas@ucar.edu $
- calendar :
- All years have exactly 365 days.
- start_time :
- This dataset was created on 2018-12-14 at 16:05:58.8
- cell_methods :
- cell_methods = time: mean ==> the variable values are averaged over the time interval between the previous time coordinate and the current one. cell_methods absent ==> the variable values are at the time given by the current time coordinate.
to_xgcm_grid_dataset() also created an xgcm.Grid object named grid. This object will make it easy to do grid-aware interpolation and differencing later on.
grid
<xgcm.Grid>
Y Axis (not periodic, boundary=None):
  * center   nlat_t --> right
  * right    nlat_u --> center
Z Axis (not periodic, boundary=None):
  * center   z_t --> left
  * right    z_w_bot --> center
  * left     z_w_top --> center
X Axis (not periodic, boundary=None):
  * center   nlon_t --> right
  * right    nlon_u --> center
Calculations#
1) Divergence#
pure xarray version#
Note that the pure xarray functions use roll() which basically uses a periodic boundary condition at the domain edges
# using numpy/xarray mix
def div_4pt_xr(U, V):
    """
    POP stencil operator for divergence
    using xarray
    """
    U_at_lat_t = U + U.roll(nlat=1, roll_coords=False)  # avg U in y
    dUdx = U_at_lat_t - U_at_lat_t.roll(nlon=1, roll_coords=False)  # dU/dx
    V_at_lon_t = V + V.roll(nlon=1, roll_coords=False)  # avg V in x
    dVdy = V_at_lon_t - V_at_lon_t.roll(nlat=1, roll_coords=False)  # dV/dy
    return dUdx + dVdy


def divh_xr(U, V, dsgrid):
    """
    calulate divergence
    """
    changed_U = 0.5 * U * dsgrid.DYU * dsgrid.DZU
    changed_V = 0.5 * V * dsgrid.DXU * dsgrid.DZU
    div = div_4pt_xr(changed_U, changed_V) / (dsgrid.TAREA * dsgrid.DZT)
    return div
div_xr = divh_xr(ds.UVEL, ds.VVEL, ds)
div_xr
<xarray.DataArray (time: 1, z_t: 62, nlat: 305, nlon: 1301)>
array([[[[            nan,  2.82245835e-06,  6.25143603e-06, ...,
                      nan,             nan,             nan],
         [            nan, -1.80508841e-08,  8.54803433e-08, ...,
                      nan,             nan,             nan],
         [            nan,  4.01141917e-08,  1.07027005e-07, ...,
                      nan,             nan,             nan],
         ...,
         [ 1.52036280e-06, -1.44758122e-08, -3.50509592e-09, ...,
          -1.28452313e-06, -1.62644312e-06, -1.83187388e-06],
         [ 1.06668597e-06, -6.68358532e-09, -5.60290977e-08, ...,
          -5.00422545e-07, -3.13788872e-07, -1.78077049e-07],
         [-2.87810620e-06,  4.21211314e-09, -7.58155615e-08, ...,
           1.14357903e-06,  1.42170407e-06,  1.61619525e-06]],

        [[            nan,  1.74533743e-06,  5.22284492e-06, ...,
                      nan,             nan,             nan],
         [            nan,  1.08072630e-07,  2.01164913e-07, ...,
                      nan,             nan,             nan],
         [            nan,  1.64829881e-07,  2.12093400e-07, ...,
                      nan,             nan,             nan],
...
         [            nan,             nan,             nan, ...,
                      nan,             nan,             nan],
         [            nan,             nan,             nan, ...,
                      nan,             nan,             nan],
         [            nan,             nan,             nan, ...,
                      nan,             nan,             nan]],

        [[            nan,             nan,             nan, ...,
                      nan,             nan,             nan],
         [            nan,             nan,             nan, ...,
                      nan,             nan,             nan],
         [            nan,             nan,             nan, ...,
                      nan,             nan,             nan],
         ...,
         [            nan,             nan,             nan, ...,
                      nan,             nan,             nan],
         [            nan,             nan,             nan, ...,
                      nan,             nan,             nan],
         [            nan,             nan,             nan, ...,
                      nan,             nan,             nan]]]])
Coordinates:
  * time     (time) object 0036-12-07 00:00:00
  * z_t      (z_t) float32 500.0 1.5e+03 2.5e+03 ... 5.625e+05 5.875e+05
    ULONG    (nlat, nlon) float64 160.0 160.1 160.2 160.3 ... -70.2 -70.1 -70.0
    ULAT     (nlat, nlon) float64 -15.03 -15.03 -15.03 ... 15.03 15.03 15.03
    TLONG    (nlat, nlon) float64 159.9 160.0 160.1 160.2 ... 289.8 289.9 290.0
    TLAT     (nlat, nlon) float64 -15.07 -15.07 -15.07 ... 14.98 14.98 14.98
Dimensions without coordinates: nlat, nlon- time: 1
- z_t: 62
- nlat: 305
- nlon: 1301
- nan 2.822e-06 6.251e-06 8.028e-06 7.417e-06 ... nan nan nan nan nan
array([[[[ nan, 2.82245835e-06, 6.25143603e-06, ..., nan, nan, nan], [ nan, -1.80508841e-08, 8.54803433e-08, ..., nan, nan, nan], [ nan, 4.01141917e-08, 1.07027005e-07, ..., nan, nan, nan], ..., [ 1.52036280e-06, -1.44758122e-08, -3.50509592e-09, ..., -1.28452313e-06, -1.62644312e-06, -1.83187388e-06], [ 1.06668597e-06, -6.68358532e-09, -5.60290977e-08, ..., -5.00422545e-07, -3.13788872e-07, -1.78077049e-07], [-2.87810620e-06, 4.21211314e-09, -7.58155615e-08, ..., 1.14357903e-06, 1.42170407e-06, 1.61619525e-06]], [[ nan, 1.74533743e-06, 5.22284492e-06, ..., nan, nan, nan], [ nan, 1.08072630e-07, 2.01164913e-07, ..., nan, nan, nan], [ nan, 1.64829881e-07, 2.12093400e-07, ..., nan, nan, nan], ... [ nan, nan, nan, ..., nan, nan, nan], [ nan, nan, nan, ..., nan, nan, nan], [ nan, nan, nan, ..., nan, nan, nan]], [[ nan, nan, nan, ..., nan, nan, nan], [ nan, nan, nan, ..., nan, nan, nan], [ nan, nan, nan, ..., nan, nan, nan], ..., [ nan, nan, nan, ..., nan, nan, nan], [ nan, nan, nan, ..., nan, nan, nan], [ nan, nan, nan, ..., nan, nan, nan]]]]) - time(time)object0036-12-07 00:00:00
- long_name :
- time
- bounds :
- time_bound
array([cftime.DatetimeNoLeap(36, 12, 7, 0, 0, 0, 0)], dtype=object)
- z_t(z_t)float32500.0 1.5e+03 ... 5.875e+05
- long_name :
- depth from surface to midpoint of layer
- units :
- centimeters
- positive :
- down
- valid_min :
- 500.0
- valid_max :
- 587499.06
array([5.000000e+02, 1.500000e+03, 2.500000e+03, 3.500000e+03, 4.500000e+03, 5.500000e+03, 6.500000e+03, 7.500000e+03, 8.500000e+03, 9.500000e+03, 1.050000e+04, 1.150000e+04, 1.250000e+04, 1.350000e+04, 1.450000e+04, 1.550000e+04, 1.650984e+04, 1.754790e+04, 1.862913e+04, 1.976603e+04, 2.097114e+04, 2.225783e+04, 2.364088e+04, 2.513702e+04, 2.676542e+04, 2.854837e+04, 3.051192e+04, 3.268680e+04, 3.510935e+04, 3.782276e+04, 4.087846e+04, 4.433777e+04, 4.827367e+04, 5.277280e+04, 5.793729e+04, 6.388626e+04, 7.075633e+04, 7.870025e+04, 8.788252e+04, 9.847059e+04, 1.106204e+05, 1.244567e+05, 1.400497e+05, 1.573946e+05, 1.764003e+05, 1.968944e+05, 2.186457e+05, 2.413972e+05, 2.649001e+05, 2.889385e+05, 3.133405e+05, 3.379793e+05, 3.627670e+05, 3.876452e+05, 4.125768e+05, 4.375392e+05, 4.625190e+05, 4.875083e+05, 5.125028e+05, 5.375000e+05, 5.624991e+05, 5.874991e+05], dtype=float32) - ULONG(nlat, nlon)float64160.0 160.1 160.2 ... -70.1 -70.0
- long_name :
- array of u-grid longitudes
- units :
- degrees_east
array([[160. , 160.1, 160.2, ..., -70.2, -70.1, -70. ], [160. , 160.1, 160.2, ..., -70.2, -70.1, -70. ], [160. , 160.1, 160.2, ..., -70.2, -70.1, -70. ], ..., [160. , 160.1, 160.2, ..., -70.2, -70.1, -70. ], [160. , 160.1, 160.2, ..., -70.2, -70.1, -70. ], [160. , 160.1, 160.2, ..., -70.2, -70.1, -70. ]]) - ULAT(nlat, nlon)float64-15.03 -15.03 ... 15.03 15.03
- long_name :
- array of u-grid latitudes
- units :
- degrees_north
array([[-15.02645786, -15.02645786, -15.02645786, ..., -15.02645786, -15.02645786, -15.02645786], [-14.92983365, -14.92983365, -14.92983365, ..., -14.92983365, -14.92983365, -14.92983365], [-14.83316612, -14.83316612, -14.83316612, ..., -14.83316612, -14.83316612, -14.83316612], ..., [ 14.83316612, 14.83316612, 14.83316612, ..., 14.83316612, 14.83316612, 14.83316612], [ 14.92983365, 14.92983365, 14.92983365, ..., 14.92983365, 14.92983365, 14.92983365], [ 15.02645786, 15.02645786, 15.02645786, ..., 15.02645786, 15.02645786, 15.02645786]]) - TLONG(nlat, nlon)float64159.9 160.0 160.1 ... 289.9 290.0
- long_name :
- array of t-grid longitudes
- units :
- degrees_east
array([[159.95, 160.05, 160.15, ..., 289.75, 289.85, 289.95], [159.95, 160.05, 160.15, ..., 289.75, 289.85, 289.95], [159.95, 160.05, 160.15, ..., 289.75, 289.85, 289.95], ..., [159.95, 160.05, 160.15, ..., 289.75, 289.85, 289.95], [159.95, 160.05, 160.15, ..., 289.75, 289.85, 289.95], [159.95, 160.05, 160.15, ..., 289.75, 289.85, 289.95]]) - TLAT(nlat, nlon)float64-15.07 -15.07 ... 14.98 14.98
- long_name :
- array of t-grid latitudes
- units :
- degrees_north
array([[-15.07475365, -15.07475365, -15.07475365, ..., -15.07475365,
        -15.07475365, -15.07475365],
       [-14.9781512 , -14.9781512 , -14.9781512 , ..., -14.9781512 ,
        -14.9781512 , -14.9781512 ],
       [-14.8815053 , -14.8815053 , -14.8815053 , ..., -14.8815053 ,
        -14.8815053 , -14.8815053 ],
       ...,
       [ 14.7848162 ,  14.7848162 ,  14.7848162 , ...,  14.7848162 ,
         14.7848162 ,  14.7848162 ],
       [ 14.8815053 ,  14.8815053 ,  14.8815053 , ...,  14.8815053 ,
         14.8815053 ,  14.8815053 ],
       [ 14.9781512 ,  14.9781512 ,  14.9781512 , ...,  14.9781512 ,
         14.9781512 ,  14.9781512 ]])
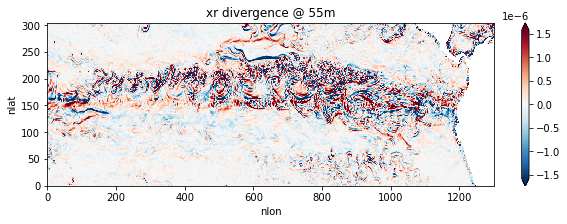
div_xr.isel(z_t=5, time=0).plot(robust=True, figsize=(10, 3))
plt.title("xr divergence @ {:d}m".format(int(div_xr.z_t.isel(z_t=5).values / 100)));
Minimal xgcm version#
Instead of using xarray’s roll(), we can use xgcm’s diff() and interp():
# using xgcm
def div_4pt_xgcm(U, V):  # Basic stencil operator for B-grid divergence
    """
    POP stencil operator for divergence
    using xgcm
    """
    U_at_lat_t = grid.interp(U, axis="Y", boundary="extend")  # array - array.roll becomes interp
    # -> this incoorporates the * 0.5
    dUdx = grid.diff(U_at_lat_t, axis="X", boundary="extend")  # - becomes diff
    V_at_lon_t = grid.interp(V, axis="X", boundary="extend")
    dVdy = grid.diff(V_at_lon_t, axis="Y", boundary="extend")
    div_4pt = dUdx + dVdy
    return div_4pt


def divh_xgcm(U, V, ds_grid):  # Divergence of horizontal velocity. Result on T-grid
    """
    calulate divergence with xgcm
    """
    changed_U = U * ds_grid.DYU * ds_grid.DZU
    changed_V = V * ds_grid.DXU * ds_grid.DZU
    divh = div_4pt_xgcm(changed_U, changed_V) / (ds_grid.TAREA * ds_grid.DZT)
    return divh
div_xgcm = divh_xgcm(ds_ren.UVEL, ds_ren.VVEL, ds_ren)
div_xgcm
<xarray.DataArray (time: 1, z_t: 62, nlat_t: 305, nlon_t: 1301)>
array([[[[ 0.00000000e+00, -1.22930843e-06, -3.79666626e-08, ...,
                      nan,             nan,             nan],
         [ 1.29710470e-06, -1.80508841e-08,  8.54803433e-08, ...,
                      nan,             nan,             nan],
         [ 4.90406732e-07,  4.01141917e-08,  1.07027005e-07, ...,
                      nan,             nan,             nan],
         ...,
         [ 1.55323600e-07, -1.44758122e-08, -3.50509592e-09, ...,
          -1.28452313e-06, -1.62644312e-06, -1.83187388e-06],
         [ 1.10498548e-07, -6.68358532e-09, -5.60290977e-08, ...,
          -5.00422545e-07, -3.13788872e-07, -1.78077049e-07],
         [ 1.59686076e-07,  4.21211314e-09, -7.58155615e-08, ...,
           1.14357903e-06,  1.42170407e-06,  1.61619525e-06]],

        [[ 0.00000000e+00, -1.14137591e-06,  3.27276755e-08, ...,
                      nan,             nan,             nan],
         [ 1.33188653e-06,  1.08072630e-07,  2.01164913e-07, ...,
                      nan,             nan,             nan],
         [ 5.30723976e-07,  1.64829881e-07,  2.12093400e-07, ...,
                      nan,             nan,             nan],
...
         [            nan,             nan,             nan, ...,
                      nan,             nan,             nan],
         [            nan,             nan,             nan, ...,
                      nan,             nan,             nan],
         [            nan,             nan,             nan, ...,
                      nan,             nan,             nan]],

        [[            nan,             nan,             nan, ...,
                      nan,             nan,             nan],
         [            nan,             nan,             nan, ...,
                      nan,             nan,             nan],
         [            nan,             nan,             nan, ...,
                      nan,             nan,             nan],
         ...,
         [            nan,             nan,             nan, ...,
                      nan,             nan,             nan],
         [            nan,             nan,             nan, ...,
                      nan,             nan,             nan],
         [            nan,             nan,             nan, ...,
                      nan,             nan,             nan]]]])
Coordinates:
  * time     (time) object 0036-12-07 00:00:00
  * z_t      (z_t) float32 500.0 1.5e+03 2.5e+03 ... 5.625e+05 5.875e+05
  * nlat_t   (nlat_t) float64 0.5 1.5 2.5 3.5 4.5 ... 301.5 302.5 303.5 304.5
  * nlon_t   (nlon_t) float64 0.5 1.5 2.5 3.5 ... 1.298e+03 1.3e+03 1.3e+03
    TLONG    (nlat_t, nlon_t) float64 159.9 160.0 160.1 ... 289.8 289.9 290.0
TLAT (nlat_t, nlon_t) float64 -15.07 -15.07 -15.07 ... 14.98 14.98 14.98- time: 1
- z_t: 62
- nlat_t: 305
- nlon_t: 1301
- 0.0 -1.229e-06 -3.797e-08 1.249e-06 2.295e-06 ... nan nan nan nan nan
array([[[[ 0.00000000e+00, -1.22930843e-06, -3.79666626e-08, ..., nan, nan, nan], [ 1.29710470e-06, -1.80508841e-08, 8.54803433e-08, ..., nan, nan, nan], [ 4.90406732e-07, 4.01141917e-08, 1.07027005e-07, ..., nan, nan, nan], ..., [ 1.55323600e-07, -1.44758122e-08, -3.50509592e-09, ..., -1.28452313e-06, -1.62644312e-06, -1.83187388e-06], [ 1.10498548e-07, -6.68358532e-09, -5.60290977e-08, ..., -5.00422545e-07, -3.13788872e-07, -1.78077049e-07], [ 1.59686076e-07, 4.21211314e-09, -7.58155615e-08, ..., 1.14357903e-06, 1.42170407e-06, 1.61619525e-06]], [[ 0.00000000e+00, -1.14137591e-06, 3.27276755e-08, ..., nan, nan, nan], [ 1.33188653e-06, 1.08072630e-07, 2.01164913e-07, ..., nan, nan, nan], [ 5.30723976e-07, 1.64829881e-07, 2.12093400e-07, ..., nan, nan, nan], ... [ nan, nan, nan, ..., nan, nan, nan], [ nan, nan, nan, ..., nan, nan, nan], [ nan, nan, nan, ..., nan, nan, nan]], [[ nan, nan, nan, ..., nan, nan, nan], [ nan, nan, nan, ..., nan, nan, nan], [ nan, nan, nan, ..., nan, nan, nan], ..., [ nan, nan, nan, ..., nan, nan, nan], [ nan, nan, nan, ..., nan, nan, nan], [ nan, nan, nan, ..., nan, nan, nan]]]]) - time(time)object0036-12-07 00:00:00
- long_name :
- time
- bounds :
- time_bound
array([cftime.DatetimeNoLeap(36, 12, 7, 0, 0, 0, 0)], dtype=object)
- z_t(z_t)float32500.0 1.5e+03 ... 5.875e+05
- long_name :
- depth from surface to midpoint of layer
- units :
- centimeters
- positive :
- down
- valid_min :
- 500.0
- valid_max :
- 587499.06
- axis :
- Z
array([5.000000e+02, 1.500000e+03, 2.500000e+03, 3.500000e+03, 4.500000e+03, 5.500000e+03, 6.500000e+03, 7.500000e+03, 8.500000e+03, 9.500000e+03, 1.050000e+04, 1.150000e+04, 1.250000e+04, 1.350000e+04, 1.450000e+04, 1.550000e+04, 1.650984e+04, 1.754790e+04, 1.862913e+04, 1.976603e+04, 2.097114e+04, 2.225783e+04, 2.364088e+04, 2.513702e+04, 2.676542e+04, 2.854837e+04, 3.051192e+04, 3.268680e+04, 3.510935e+04, 3.782276e+04, 4.087846e+04, 4.433777e+04, 4.827367e+04, 5.277280e+04, 5.793729e+04, 6.388626e+04, 7.075633e+04, 7.870025e+04, 8.788252e+04, 9.847059e+04, 1.106204e+05, 1.244567e+05, 1.400497e+05, 1.573946e+05, 1.764003e+05, 1.968944e+05, 2.186457e+05, 2.413972e+05, 2.649001e+05, 2.889385e+05, 3.133405e+05, 3.379793e+05, 3.627670e+05, 3.876452e+05, 4.125768e+05, 4.375392e+05, 4.625190e+05, 4.875083e+05, 5.125028e+05, 5.375000e+05, 5.624991e+05, 5.874991e+05], dtype=float32) - nlat_t(nlat_t)float640.5 1.5 2.5 ... 302.5 303.5 304.5
- axis :
- Y
array([ 0.5, 1.5, 2.5, ..., 302.5, 303.5, 304.5])
- nlon_t(nlon_t)float640.5 1.5 2.5 ... 1.3e+03 1.3e+03
- axis :
- X
array([5.0000e-01, 1.5000e+00, 2.5000e+00, ..., 1.2985e+03, 1.2995e+03, 1.3005e+03]) - TLONG(nlat_t, nlon_t)float64159.9 160.0 160.1 ... 289.9 290.0
- long_name :
- array of t-grid longitudes
- units :
- degrees_east
- grid_loc :
- 2110
array([[159.95, 160.05, 160.15, ..., 289.75, 289.85, 289.95], [159.95, 160.05, 160.15, ..., 289.75, 289.85, 289.95], [159.95, 160.05, 160.15, ..., 289.75, 289.85, 289.95], ..., [159.95, 160.05, 160.15, ..., 289.75, 289.85, 289.95], [159.95, 160.05, 160.15, ..., 289.75, 289.85, 289.95], [159.95, 160.05, 160.15, ..., 289.75, 289.85, 289.95]]) - TLAT(nlat_t, nlon_t)float64-15.07 -15.07 ... 14.98 14.98
- long_name :
- array of t-grid latitudes
- units :
- degrees_north
- grid_loc :
- 2110
array([[-15.07475365, -15.07475365, -15.07475365, ..., -15.07475365,
        -15.07475365, -15.07475365],
       [-14.9781512 , -14.9781512 , -14.9781512 , ..., -14.9781512 ,
        -14.9781512 , -14.9781512 ],
       [-14.8815053 , -14.8815053 , -14.8815053 , ..., -14.8815053 ,
        -14.8815053 , -14.8815053 ],
       ...,
       [ 14.7848162 ,  14.7848162 ,  14.7848162 , ...,  14.7848162 ,
         14.7848162 ,  14.7848162 ],
       [ 14.8815053 ,  14.8815053 ,  14.8815053 , ...,  14.8815053 ,
         14.8815053 ,  14.8815053 ],
       [ 14.9781512 ,  14.9781512 ,  14.9781512 , ...,  14.9781512 ,
         14.9781512 ,  14.9781512 ]])
div_xgcm.isel(z_t=5, time=0).plot(robust=True, figsize=(10, 3))
plt.title("xgcm divergence @ {:d}m".format(int(div_xgcm.z_t.isel(z_t=5).values / 100)));
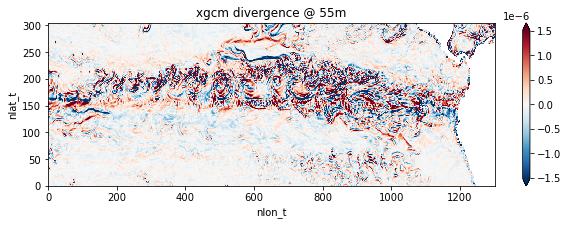
This is the same except for boundary points because the pure xarray version assumes that the boundaries are periodic
xr.testing.assert_equal(
    (
        div_xgcm.rename(
            {"nlon_t": "nlon", "nlat_t": "nlat"}
        )  # rename dimensions back to nlon, nlat
        .assign_coords(nlat=div_xr.nlat, nlon=div_xr.nlon)
        .reset_coords(drop=True)
        .isel(nlon=slice(1, -1), nlat=slice(1, -1))
    ),
    (
        div_xr.assign_coords(nlat=div_xr.nlat, nlon=div_xr.nlon)
        .reset_coords(drop=True)
        .isel(nlon=slice(1, -1), nlat=slice(1, -1))
    ),
)
xgcm with metrics#
If we create an xgcm.Grid object with the metrics term specified, the code can be substantially simplified.
For the metric capabilities we will use later on we need to define metrics for pop (this could be moved to pop_tools for convenience so that grid is always created with metrics information).
metrics is a dictionary that maps axes names (one of X, Y, Z) to distances along that axis
# pop_tools should handle this bit in the future
metrics = {
    ("X",): ["DXU", "DXT"],  # X distances
    ("Y",): ["DYU", "DYT"],  # Y distances
    ("Z",): ["DZU", "DZT"],  # Z distances
    ("X", "Y"): ["UAREA", "TAREA"],  # areas, technically not needed
}
# xgcm metrics
gridm, xdsm = pop_tools.to_xgcm_grid_dataset(ds, periodic=False, metrics=metrics)
Note that the code below does not explicitly use DZT or DZU.
def div_stencil(U, V, grid):  # Basic stencil operator for B-grid divergence
    """
    stencil operator for divergence
    using xgcm.metrics on pop
    """
    U = grid.interp(U, axis="Y", boundary="extend")
    V = grid.interp(V, axis="X", boundary="extend")
    dUdx = grid.diff(U, axis="X", boundary="extend")
    dVdy = grid.diff(V, axis="Y", boundary="extend")
    div_4pt = dUdx + dVdy
    return div_4pt


def x_divh(U, V, grid, boundary=None):
    """
    horizontal divergence
    with xgcm.get_metrics
    """
    dy = grid.get_metric(U, "Y")
    dx = grid.get_metric(V, "X")
    dz = grid.get_metric(U, "Z")
    UT = U * dy * dz
    VT = V * dx * dz
    div = div_stencil(UT, VT, grid)
    volume = grid.get_metric(div, "XYZ")
    div = div / volume

    return div


div_xgcm_m = x_divh(xdsm.UVEL, xdsm.VVEL, gridm)
div_xgcm_m
<xarray.DataArray (time: 1, z_t: 62, nlat_t: 305, nlon_t: 1301)>
array([[[[ 0.00000000e+00, -1.22930843e-06, -3.79666626e-08, ...,
                      nan,             nan,             nan],
         [ 1.29710470e-06, -1.80508841e-08,  8.54803433e-08, ...,
                      nan,             nan,             nan],
         [ 4.90406732e-07,  4.01141917e-08,  1.07027005e-07, ...,
                      nan,             nan,             nan],
         ...,
         [ 1.55323600e-07, -1.44758122e-08, -3.50509592e-09, ...,
          -1.28452313e-06, -1.62644312e-06, -1.83187388e-06],
         [ 1.10498548e-07, -6.68358532e-09, -5.60290977e-08, ...,
          -5.00422545e-07, -3.13788872e-07, -1.78077049e-07],
         [ 1.59686076e-07,  4.21211314e-09, -7.58155615e-08, ...,
           1.14357903e-06,  1.42170407e-06,  1.61619525e-06]],

        [[ 0.00000000e+00, -1.14137591e-06,  3.27276755e-08, ...,
                      nan,             nan,             nan],
         [ 1.33188653e-06,  1.08072630e-07,  2.01164913e-07, ...,
                      nan,             nan,             nan],
         [ 5.30723976e-07,  1.64829881e-07,  2.12093400e-07, ...,
                      nan,             nan,             nan],
...
         [            nan,             nan,             nan, ...,
                      nan,             nan,             nan],
         [            nan,             nan,             nan, ...,
                      nan,             nan,             nan],
         [            nan,             nan,             nan, ...,
                      nan,             nan,             nan]],

        [[            nan,             nan,             nan, ...,
                      nan,             nan,             nan],
         [            nan,             nan,             nan, ...,
                      nan,             nan,             nan],
         [            nan,             nan,             nan, ...,
                      nan,             nan,             nan],
         ...,
         [            nan,             nan,             nan, ...,
                      nan,             nan,             nan],
         [            nan,             nan,             nan, ...,
                      nan,             nan,             nan],
         [            nan,             nan,             nan, ...,
                      nan,             nan,             nan]]]])
Coordinates:
  * time     (time) object 0036-12-07 00:00:00
  * z_t      (z_t) float32 500.0 1.5e+03 2.5e+03 ... 5.625e+05 5.875e+05
  * nlat_t   (nlat_t) float64 0.5 1.5 2.5 3.5 4.5 ... 301.5 302.5 303.5 304.5
* nlon_t (nlon_t) float64 0.5 1.5 2.5 3.5 ... 1.298e+03 1.3e+03 1.3e+03- time: 1
- z_t: 62
- nlat_t: 305
- nlon_t: 1301
- 0.0 -1.229e-06 -3.797e-08 1.249e-06 2.295e-06 ... nan nan nan nan nan
array([[[[ 0.00000000e+00, -1.22930843e-06, -3.79666626e-08, ..., nan, nan, nan], [ 1.29710470e-06, -1.80508841e-08, 8.54803433e-08, ..., nan, nan, nan], [ 4.90406732e-07, 4.01141917e-08, 1.07027005e-07, ..., nan, nan, nan], ..., [ 1.55323600e-07, -1.44758122e-08, -3.50509592e-09, ..., -1.28452313e-06, -1.62644312e-06, -1.83187388e-06], [ 1.10498548e-07, -6.68358532e-09, -5.60290977e-08, ..., -5.00422545e-07, -3.13788872e-07, -1.78077049e-07], [ 1.59686076e-07, 4.21211314e-09, -7.58155615e-08, ..., 1.14357903e-06, 1.42170407e-06, 1.61619525e-06]], [[ 0.00000000e+00, -1.14137591e-06, 3.27276755e-08, ..., nan, nan, nan], [ 1.33188653e-06, 1.08072630e-07, 2.01164913e-07, ..., nan, nan, nan], [ 5.30723976e-07, 1.64829881e-07, 2.12093400e-07, ..., nan, nan, nan], ... [ nan, nan, nan, ..., nan, nan, nan], [ nan, nan, nan, ..., nan, nan, nan], [ nan, nan, nan, ..., nan, nan, nan]], [[ nan, nan, nan, ..., nan, nan, nan], [ nan, nan, nan, ..., nan, nan, nan], [ nan, nan, nan, ..., nan, nan, nan], ..., [ nan, nan, nan, ..., nan, nan, nan], [ nan, nan, nan, ..., nan, nan, nan], [ nan, nan, nan, ..., nan, nan, nan]]]]) - time(time)object0036-12-07 00:00:00
- long_name :
- time
- bounds :
- time_bound
array([cftime.DatetimeNoLeap(36, 12, 7, 0, 0, 0, 0)], dtype=object)
- z_t(z_t)float32500.0 1.5e+03 ... 5.875e+05
- long_name :
- depth from surface to midpoint of layer
- units :
- centimeters
- positive :
- down
- valid_min :
- 500.0
- valid_max :
- 587499.06
- axis :
- Z
array([5.000000e+02, 1.500000e+03, 2.500000e+03, 3.500000e+03, 4.500000e+03, 5.500000e+03, 6.500000e+03, 7.500000e+03, 8.500000e+03, 9.500000e+03, 1.050000e+04, 1.150000e+04, 1.250000e+04, 1.350000e+04, 1.450000e+04, 1.550000e+04, 1.650984e+04, 1.754790e+04, 1.862913e+04, 1.976603e+04, 2.097114e+04, 2.225783e+04, 2.364088e+04, 2.513702e+04, 2.676542e+04, 2.854837e+04, 3.051192e+04, 3.268680e+04, 3.510935e+04, 3.782276e+04, 4.087846e+04, 4.433777e+04, 4.827367e+04, 5.277280e+04, 5.793729e+04, 6.388626e+04, 7.075633e+04, 7.870025e+04, 8.788252e+04, 9.847059e+04, 1.106204e+05, 1.244567e+05, 1.400497e+05, 1.573946e+05, 1.764003e+05, 1.968944e+05, 2.186457e+05, 2.413972e+05, 2.649001e+05, 2.889385e+05, 3.133405e+05, 3.379793e+05, 3.627670e+05, 3.876452e+05, 4.125768e+05, 4.375392e+05, 4.625190e+05, 4.875083e+05, 5.125028e+05, 5.375000e+05, 5.624991e+05, 5.874991e+05], dtype=float32) - nlat_t(nlat_t)float640.5 1.5 2.5 ... 302.5 303.5 304.5
- axis :
- Y
array([ 0.5, 1.5, 2.5, ..., 302.5, 303.5, 304.5])
- nlon_t(nlon_t)float640.5 1.5 2.5 ... 1.3e+03 1.3e+03
- axis :
- X
array([5.0000e-01, 1.5000e+00, 2.5000e+00, ..., 1.2985e+03, 1.2995e+03,
       1.3005e+03])
This works as follows: grid.get_metric(U, "Y") tells xgcm to find a DY variable that is at U-points.
xgcm checks DYU and DYT (both specified as Y-distances in metrics) and chooses DYU because DYU.dims = (nlat_u, nlon_u) matches U.dims = ("time", "z_t", "nlat_u", "nlon_u")
print(xdsm.DYU.dims)
print(xdsm.UVEL.dims)
('nlat_u', 'nlon_u')
('time', 'z_t', 'nlat_u', 'nlon_u')
xr.testing.assert_equal(
    gridm.get_metric(xdsm.UVEL, "Y"),
    xdsm.DYU.reset_coords(drop=True),
)
div_xgcm_m.isel(z_t=5, time=0).plot(robust=True, figsize=(10, 3))
plt.title("xgcm_metric divergence @ {:d}m".format(int(div_xgcm_m.z_t.isel(z_t=5).values / 100)));
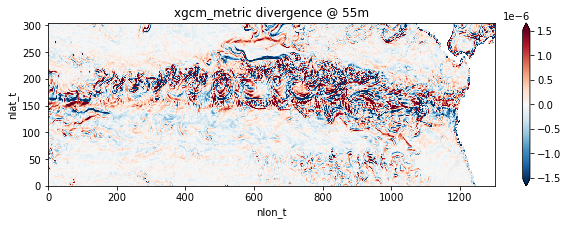
fig, ax = plt.subplots(1, 3, figsize=(20, 3))
div_xr.isel(z_t=5, time=0).plot(ax=ax[0], robust=True)
ax[0].set_title("xarray")
div_xgcm.isel(z_t=5, time=0).plot(ax=ax[1], robust=True)
ax[1].set_title("xgcm")
div_xgcm_m.isel(z_t=5, time=0).plot(ax=ax[2], robust=True)
ax[2].set_title("xgcm metrics");
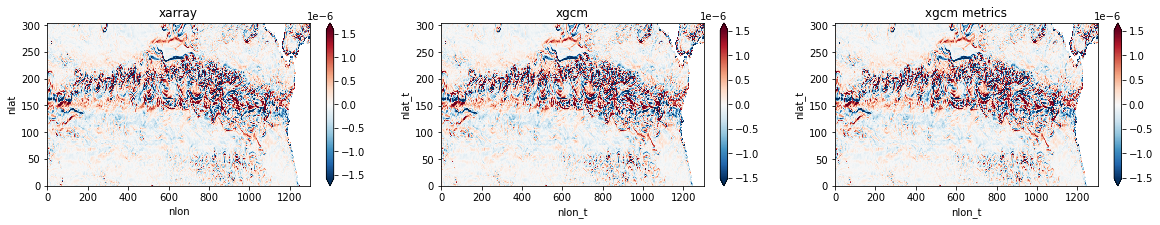
The two xgcm versions agree in the treatment of boundaries, whereas xarray assumes periodic boundaries so that the boundary values differ (the rest are the same):
fig, ax = plt.subplots(2, 1, figsize=(10, 10))
div_xgcm.isel(nlat_t=0, z_t=0).plot(label="xgcm", ax=ax[0])
div_xgcm_m.isel(nlat_t=0, z_t=0).plot(ls="--", label="metrics", ax=ax[0])
div_xr.isel(nlat=0, z_t=0).plot(label="xr", ax=ax[0], ls=':')
ax[0].legend()

div_xgcm.isel(nlat_t=1, z_t=0).plot(label="xgcm", ax=ax[1])
div_xgcm_m.isel(nlat_t=1, z_t=0).plot(ls="--", label="metrics", ax=ax[1])
div_xr.isel(nlat=1, z_t=0).plot(label="xr", ax=ax[1], ls=':')
ax[1].legend();
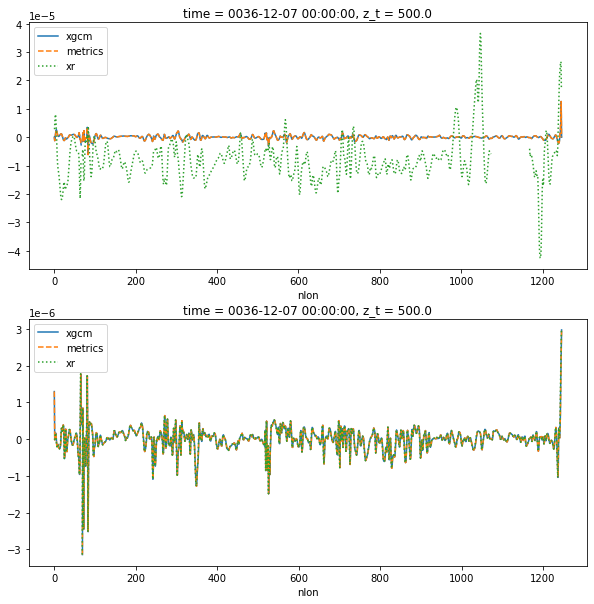
# the two xgcm versions are the same
xr.testing.assert_equal(div_xgcm.drop(["TLONG", "TLAT"]), div_xgcm_m)
2) Curl#
# define different functions for curl
def z_curl_xr(U, V, ds_grid):
    """
    xr based
    """
    vdy = 0.5 * V * ds.DYU
    udx = -0.5 * U * ds.DXU
    zcurl = div_4pt_xr(vdy, udx) / ds.TAREA
    return zcurl


def z_curl_xgcm(U, V, ds_grid):
    """
    xgcm based
    """
    WORKX = V * ds_grid.DYU
    WORKY = -U * ds_grid.DXU
    zcurl = div_4pt_xgcm(WORKX, WORKY) / ds_grid.TAREA
    return zcurl


def x_curlz(U, V, grid):
    """
    xgcm based using metrics
    """
    Udx = U * grid.get_metric(U, "X")
    Vdy = V * grid.get_metric(V, "Y")
    der = div_stencil(Vdy, -Udx, grid)
    area = grid.get_metric(der, "XY")
    curlz = der / area
    return curlz
xr_zcurl = z_curl_xr(ds.UVEL, ds.VVEL, ds)
xgcm_zcurl = z_curl_xgcm(ds_ren.UVEL, ds_ren.VVEL, ds_ren)
xgcm_m_zcurl = x_curlz(ds_ren.UVEL, ds_ren.VVEL, gridm)
fig, ax = plt.subplots(1, 3, figsize=(20, 3))
xr_zcurl.isel(z_t=5, time=0).plot(ax=ax[0], robust=True)
ax[0].set_title("xarray")
xgcm_zcurl.isel(z_t=5, time=0).plot(ax=ax[1], robust=True)
ax[1].set_title("xgcm")
xgcm_m_zcurl.isel(z_t=5, time=0).plot(ax=ax[2], robust=True)
ax[2].set_title("xgcm metrics");
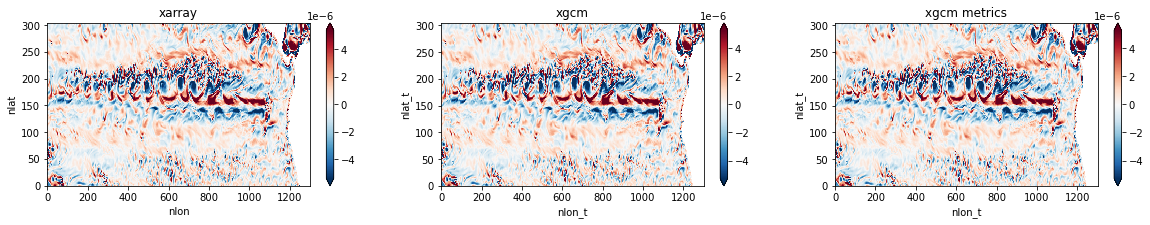
# test xgcm versions:
xr.testing.assert_equal(xgcm_zcurl.drop(["TLONG", "TLAT"]), xgcm_m_zcurl)
# test xarray vs xgcm version:
xr.testing.assert_equal(
    (
        xr_zcurl.drop(["TLONG", "TLAT", "ULONG", "ULAT"])
        .assign_coords(nlat=div_xr.nlat, nlon=div_xr.nlon)
        .reset_coords(drop=True)
        .isel(nlon=slice(1, -1), nlat=slice(1, -1))
    ),
    (
        xgcm_zcurl.rename({"nlon_t": "nlon", "nlat_t": "nlat"})
        .assign_coords(nlat=div_xr.nlat, nlon=div_xr.nlon)
        .reset_coords(drop=True)
        .isel(nlon=slice(1, -1), nlat=slice(1, -1))
    ),
)
3) Gradient#
# define different functions
# xarray
def grad_4pt_xr(F):
    """
    gradient stencil using xarray
    """
    WORK2 = F.roll(nlat=-1, roll_coords=False)  # F[i,j+1]
    WORK1 = WORK2.roll(nlon=-1, roll_coords=False) - F  # F[i+1,j+1] - F[i,j]
    WORK2 = WORK2 - F.roll(nlon=-1, roll_coords=False)  # F[i,j+1] - F[i+1,j]
    GX = WORK1 - WORK2
    GY = WORK1 + WORK2
    return GX, GY


def gradh_xr(F, DX, DY):
    """
    gradient calculation
    """
    GX, GY = grad_4pt_xr(F)
    GX = 0.5 * GX / DX
    GY = 0.5 * GY / DY
    return GX, GY


# xgcm
def grad_4pt_xgcm(F):  # Basic stencil operator for B-grid gradient (e.g. for pressure)
    """
    gradient stencil with xgcm
    """
    F_at_lat_u = grid.interp(F, axis="Y", boundary="extend")  # 0.5*(F[i,j+1]+F[i,j])
    dFdx = grid.diff(F_at_lat_u, axis="X", boundary="extend")
    F_at_lon_u = grid.interp(F, axis="X", boundary="extend")  # 0.5*(F[i+1,j]+F[i,j])
    dFdy = grid.diff(F_at_lon_u, axis="Y", boundary="extend")
    return dFdx, dFdy


def gradh_xgcm(F, ds_grid):  # Gradient of scalar. Result on U-grid
    """
    gradient of scalar
    """
    GX, GY = grad_4pt_xgcm(F)
    GX = GX / ds_grid.DXU
    GY = GY / ds_grid.DYU
    return GX, GY


# xgcm_metrics -> this becomes really easy!
def x_gradh(F, grid):
    """
    gradient of scalar xgcm_metrics
    for pop
    """
    F_yi = grid.interp(F, axis="Y", boundary="extend")  # 0.5*(F[i,j+1]+F[i,j])
    F_xi = grid.interp(F, axis="X", boundary="extend")  # 0.5*(F[i+1,j]+F[i,j])
    dFdx = grid.derivative(F_yi, axis="X", boundary="extend")
    dFdy = grid.derivative(F_xi, axis="Y", boundary="extend")
    return dFdx, dFdy
# test different versions
GX_x, GY_x = gradh_xr(ds.TEMP, ds.DXU, ds.DYU)  # xarray version
GX_xgcm, GY_xgcm = gradh_xgcm(ds_ren.TEMP, ds_ren)  # xgcm version
GX_xgcm_m, GY_xgcm_m = x_gradh(ds_ren.TEMP, gridm)  # xgcm metrics version
fig, ax = plt.subplots(2, 3, figsize=(20, 6))
GX_x.isel(z_t=5, time=0).plot(ax=ax[0, 0], robust=True)
ax[0, 0].set_title("xarray")
GX_xgcm.isel(z_t=5, time=0).plot(ax=ax[0, 1], robust=True)
ax[0, 1].set_title("xgcm")
GX_xgcm_m.isel(z_t=5, time=0).plot(ax=ax[0, 2], robust=True)
ax[0, 2].set_title("xgcm metrics")

GY_x.isel(z_t=5, time=0).plot(ax=ax[1, 0], robust=True)
ax[1, 0].set_title("")
GY_xgcm.isel(z_t=5, time=0).plot(ax=ax[1, 1], robust=True)
ax[1, 1].set_title("")
GY_xgcm_m.isel(z_t=5, time=0).plot(ax=ax[1, 2], robust=True)
ax[1, 2].set_title("");
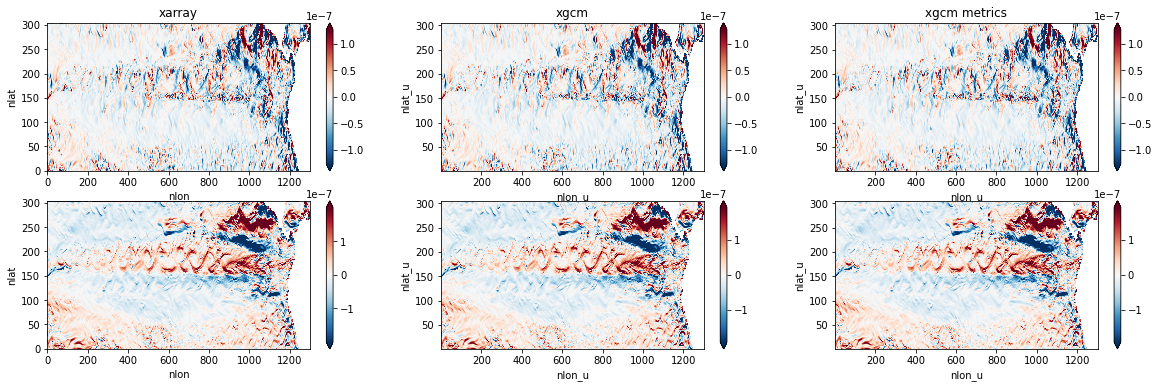
# testing xgcm version:
xr.testing.assert_equal(GX_xgcm_m, GX_xgcm.drop(["ULONG", "ULAT"]))
# testing xarray version xgcm version:
xr.testing.assert_allclose(
    (
        GX_x.drop(["TLONG", "TLAT", "ULONG", "ULAT"])
        .assign_coords(nlat=div_xr.nlat, nlon=div_xr.nlon)
        .reset_coords(drop=True)
        .isel(nlon=slice(1, -1), nlat=slice(1, -1))
    ),
    (
        GX_xgcm_m.rename({"nlon_u": "nlon", "nlat_u": "nlat"})
        .assign_coords(nlat=div_xr.nlat, nlon=div_xr.nlon)
        .reset_coords(drop=True)
        .isel(nlon=slice(1, -1), nlat=slice(1, -1))
    ),
)
%load_ext watermark
%watermark -d -iv -m -g
Compiler    : Clang 11.0.1
OS          : Darwin
Release     : 19.6.0
Machine     : x86_64
Processor   : i386
CPU cores   : 8
Architecture: 64bit

Git hash: 824cc23a5f921ee3ecf3fe3947cb435dd532e451

xarray    : 0.17.0
numpy     : 1.20.1
xgcm      : 0.5.1
matplotlib: 3.3.4
pop_tools : 2020.12.15.post10+dirty